Bitcoin Technical Analysis: 14 MAR 2025

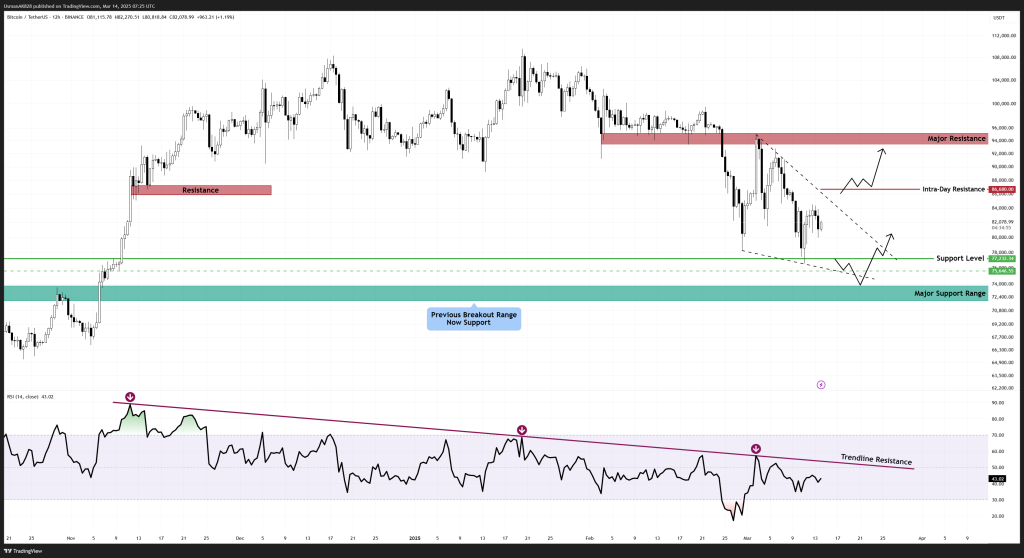
RSI breakout could be a pivotal shift in momentum for the day. Source: TradingView
General View
Bitcoin’s corrective phase is now starting to show some signs of resilience against selling pressure after bouncing from the key support levels. The price is still maintaining the falling wedge pattern, which is one of the bullish patterns. Meanwhile the pattern breakout is yet to be confirmed, but bulls are gradually gaining control and lining up for a move higher. The RSI is in a position to trigger a breakout above the trendline resistance. If that happens, it will be a confirmation of bullish momentum.
On the Upside
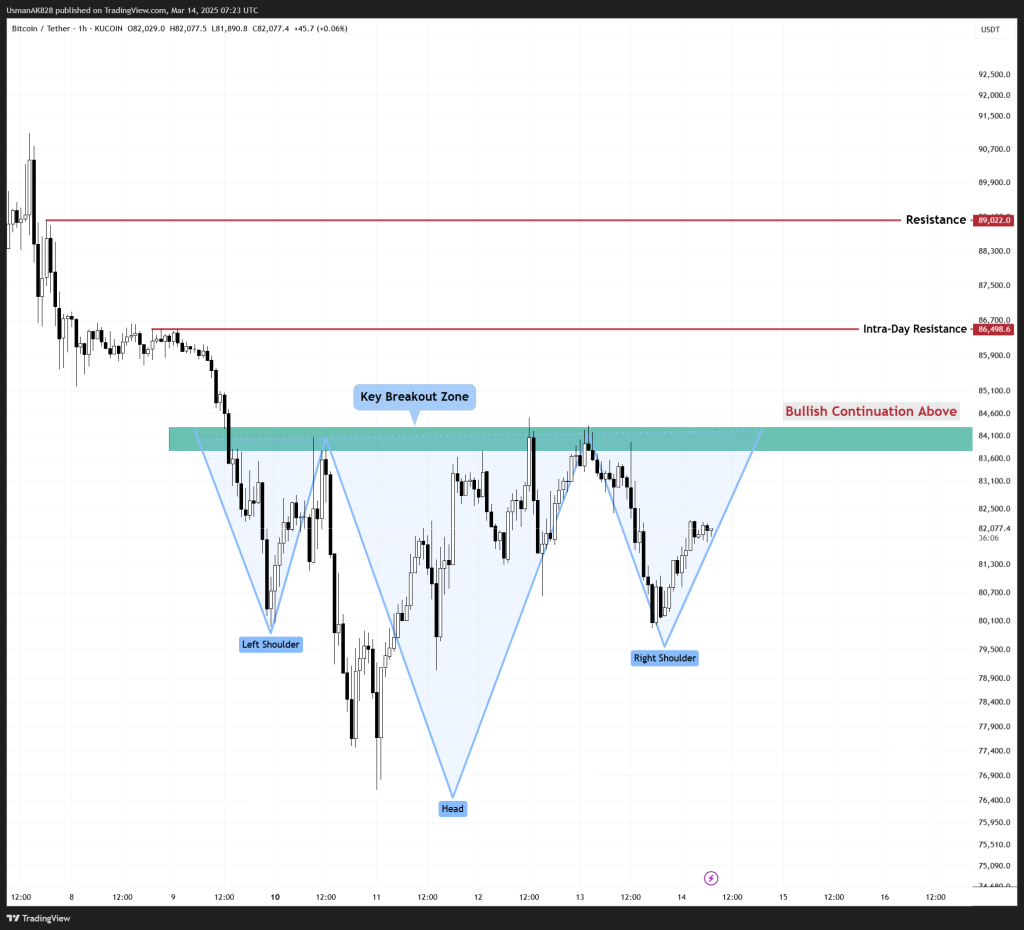
The immediate resistance remains firm at $84,200 to $84,500 levels. This is the key level that bulls are watching, as a breakout above would open considerable upside for Bitcoin. Strength above $84,500 would push the price higher towards the $86,680 level. On the lower timeframes, this is a meaningful resistance and holds the strength to challenge bulls. The upside could only extend further if this resistance level of $86,680 is broken.
On the Downside,
In yesterday’s session, the price once again tested the support level of $80,050. Once again, a decent reaction was observed off this level, pushing the price back higher. This support at $80,050 will continue to act as primary support for the day. Additionally, the bulls are now attempting to convert $81,700 into support. Successfully doing so would further strengthen the bullish case. Meanwhile, any breakdown below $80,050 would once again accelerate the selling pressure, exposing the price towards the $77,250 to $75,650 zone.

Inverse head and shoulder pattern on Bitcoin. Source: TradingView