


- PEPE breaks out of a logarithmic broadening wedge, hinting at a potential 1,200% upside move.
- Technical indicators and higher lows support a bullish short-term trend as resistance near $0.00000810 comes into focus.
- With renewed memecoin interest and volume building, traders eye PEPE for another explosive rally toward $0.00001000.
Pepe Coin (PEPE), one of the leading meme coins in the crypto market, is showing signs of a potential bullish reversal after weeks of sideways consolidation. According to a recent post by popular crypto analysis platform Bitcoinsensus on X, PEPE has broken out of a key technical pattern, indicating that the meme coin might show bullish momentum.
The price volatility pattern is characterized by two diverging trendlines forming a wideening structure. PEPE has been known to break upward after reaching a lower support trendline previously, which is also shown on the chart, so if this continues, then PEPE could also start a new bullish move there.
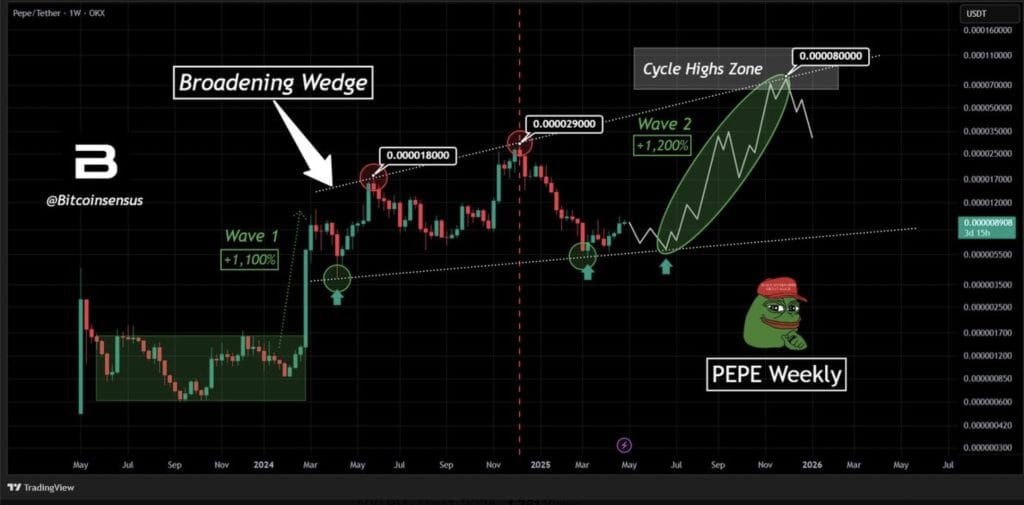
The first major rally was Wave 1, where PEPE was up over 1,100% at $0.000018000. Months later, the token had a second leg higher, which sent the token to a new high of about $0.000029000. Since then the price continues to work its way lower and finds support once again against the bottom boundary of the wedge. A green circle shows the recent bounce from this level, meaning there may be an opportunity to reverse and enter another upwards phase.
The current analysis points to a possible new bullish wave Wave 2 with an expected upside of 1,200%. The green area of the projection zone indicates the gradual rise of price action until a potential target at around price $0.000080000. The PEPE would be a cycle-high and be a massive gain from current levels as the coin trades for $0.000008908 as of the time of analysis.
The chart has also shown support levels that once before were tested, and it implies that bulls may try to regain control. If the price still respects the wedge structure and volume picks up, the break out can resemble the previous surge. With that said, nothing is guaranteed in the market, but that setup would indicate that PEPE might be entering a new phase of upward movement similar to its earlier explosive movement.
PEPE Price Analysis
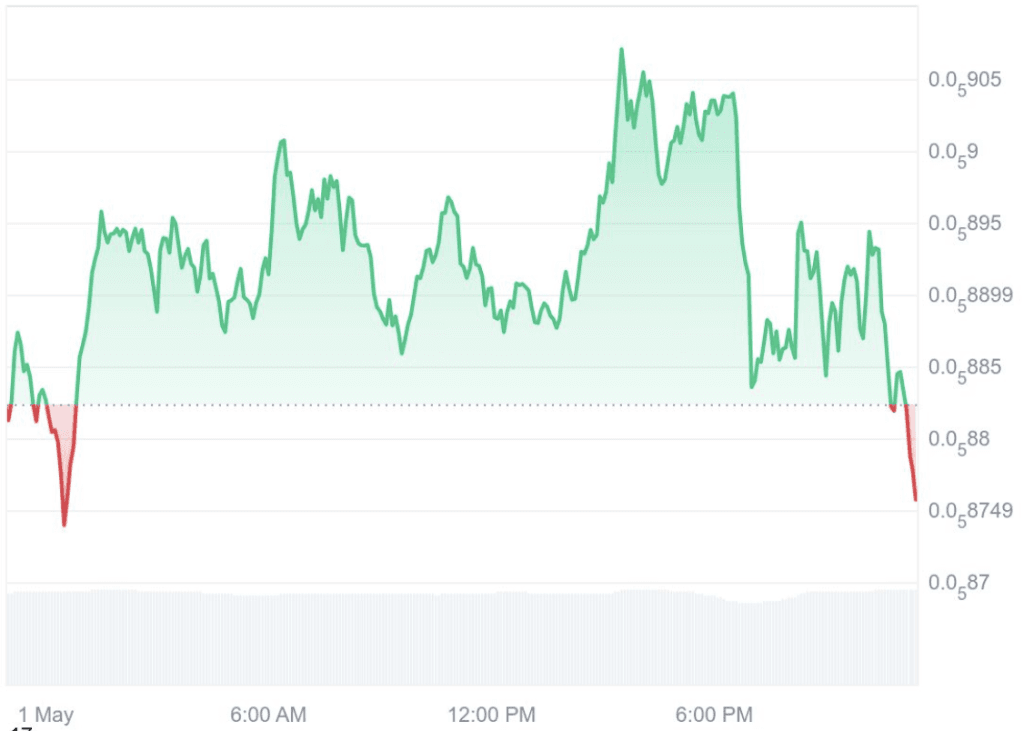
As of May 1, PEPE is trading at approximately $0.000008785, reflecting a 1% decrease over the past 24 hours. The 24-hour trading volume stands at around $538 million, with a market capitalization of approximately $3.69 billion. The circulating supply is nearly 420.68 trillion PEPE tokens, close to its maximum supply of 420.69 trillion.
Currently, PEPE is trading at just 69% below its all-time high of $0.00002825 reached on 9th, December 2024. Although, the coin continues to be quite high from its all-time low of $0.0000000001062 on April 14, 2023.
Now, the price is getting close to a resistance level of $0.00000810. If it gets out above that zone, with sufficient volume, it will have to move towards the $0.00000950 to $0.00001000 range. Relative Strength Index (RSI) on the 4 hour chart is near the overbought zone, but it hasn’t yet given the pullback signal. It also supports the idea of a short-term bullish outlook when the 200-period EMA is trending upward.
The upward momentum may be formed after a recent breakout of a wedge pattern and higher lows on the chart. At the same time, the trading in key coins like Bitcoin is temporarily quiet, which makes traders see the small-cap coins. Given the risks of memecoins, such running behavior should be interpreted not as a fallacy of the market, but as an indication of increasing involvement. With resistance cleared, PEPE could test higher once more.


