


AVAX Technical Analysis: 15 APR 2025
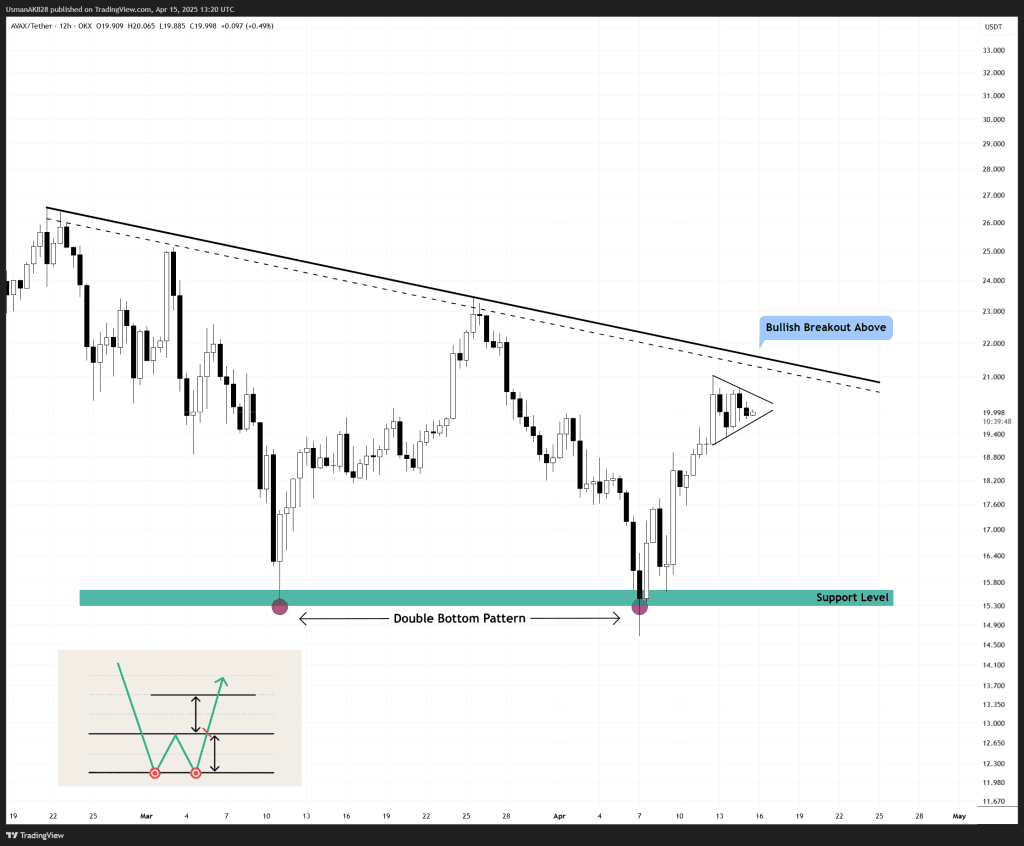
A potential double bottom in making for AVAX. Source: TradingView
General View
AVAX has been looking very strong since bouncing back from its double bottom formation. This recovery has brought the price back into the upper half of a descending wedge. More recently, price action has compressed into a symmetrical triangle, signaling a potential continuation ahead. While the broader trend remains bearish, the recent shift in momentum hints at a potential reversal in favor of the bulls.
On The Upside
Price is now trading just beneath a long-standing descending trendline that has capped every major rally. A decisive break above $20.60 to $21.20 levels could serve as the first sign of strength, potentially confirming the bullish breakout from both the triangle and wedge patterns. If bulls can overcome this resistance, the price may accelerate quickly towards $22.50 to $23.00 levels next.
On The Downside
AVAX has added several intra-day supports along the way. The primary support for the session is positioned at 19.70, followed by 18.80. Meanwhile, below this range, the next supportive range is at 17.80 to 17.55 levels. Bulls are likely to defend the intra-day supports for the day.
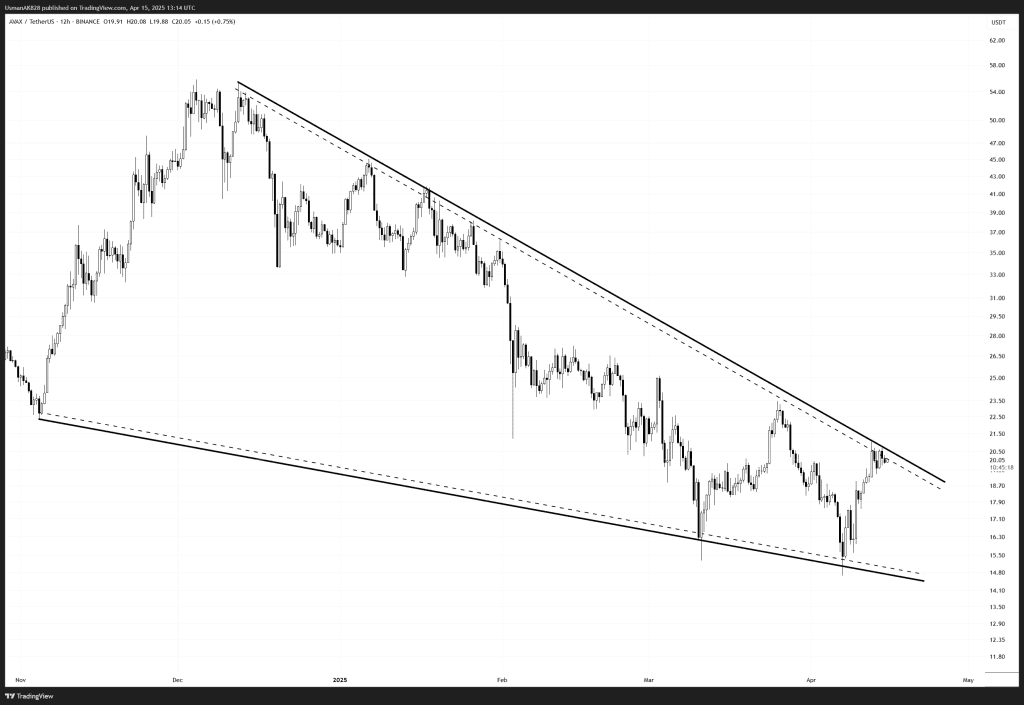
Falling wedge pattern breakout is looking imminent! Source: TradingView


