


- Cardano price consolidates in a tight triangle pattern, indicating a breakout
- $0.65 resistance and $0.60 support define ADA’s short-term range
- ADA could swing 30% once triangle formation completes a breakout
Cardano (ADA) price has been moving sideways while staying below its key support zone. ADA recently faced mild bearish pressure, failing to break upward. The token is currently attempting a recovery, but its range remains narrow. Over the past seven days, ADA has declined as most digital assets trade in uncertainty.
Solana (SOL) is holding steady around the $130 mark, while Bitcoin (BTC) remains below $85,000. Ethereum (ETH) continues to hover near $1,500 without showing strong momentum. The overall crypto market is slightly up, with the global market cap now standing at $2.67 trillion.
However, total market volume has dropped 19.63% in 24 hours to $58.11 billion, reflecting reduced trading activity.
Cardano Price Triangle Formation Signals Imminent 30% Price Move
A crypto analyst posted that Cardano price spent time inside a symmetrical triangle pattern, which predicted an upcoming price move. The crypto shows confined price movement between contracting support lines and resistance levels, which signals that a major price movement will soon occur while volatility remains low.
A price movement of approximately 30% might occur according to the analyst’s projections once ADA leaves behind this formation. The pattern formed over multiple weeks has reached its apex point to generate future steep price movements.
The cryptocurrency has the potential to advance to $0.80 if it breaks out at $0.62 but could potentially reach $0.45 after breaking down from $0.57. The trading pattern reveals market uncertainty because traders are waiting for volume indicators that will signal upcoming market movement.
Cardano Price Consolidates With Targets at $1
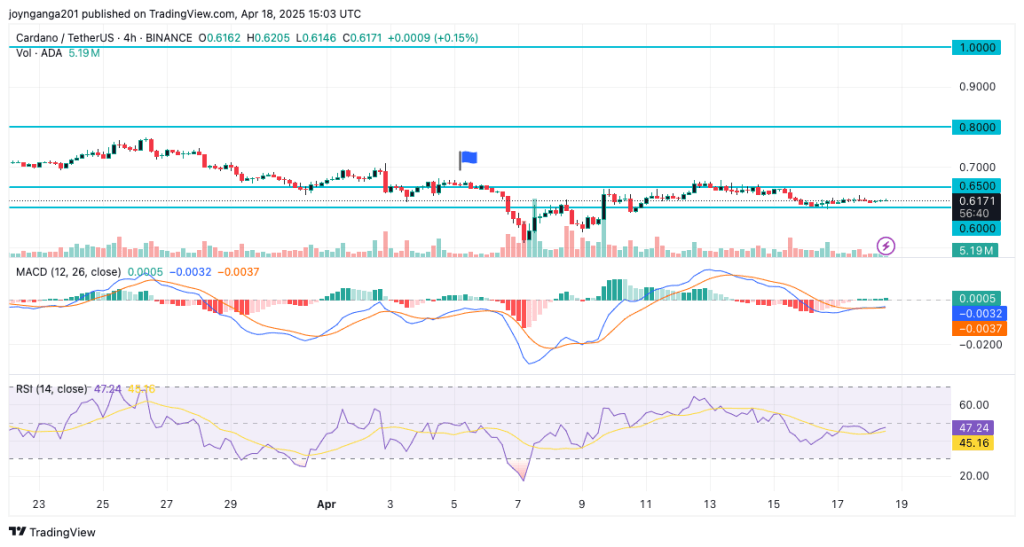
As of the reporting time, the ADA price is hovering near $0.6170 after moving slightly from the $0.6146 low. The chart shows Cardano remains in a consolidation zone between $0.6000 and $0.6500, lacking strong directional momentum.
The resistance level at $0.65 remains intact, while $0.60 acts as a reliable short-term support. A breakout above $0.65 could push ADA toward the next resistance near $0.8. If the momentum strengthens further, the long-term target remains around the $1.0 psychological mark. On the downside, any drop below $0.60 may trigger selling pressure, sending ADA back to lower support zones. However, recent volume data shows steady interest, with 40 million ADA traded on the Binance 4-hour chart.
The Moving Average Convergence Divergence (MACD) shows a modest bullish crossover. The MACD line is at 0.0005, just above the signal line at -0.0032. This signals mild upward momentum, although it remains weak. The histogram also confirms a recent shift toward green bars, suggesting early signs of a trend reversal. Meanwhile, the Relative Strength Index (RSI) stands at 47, reflecting neutral market strength. It also indicates the potential for further price accumulation before a significant move.
If bullish momentum returns, the first upside target lies at $0.65, followed by $0.80, and then $1.0. However, if the price weakens, traders may watch $0.6000 for breakdown signals.


