


AVAX Technical Analysis: 18 APR 2025
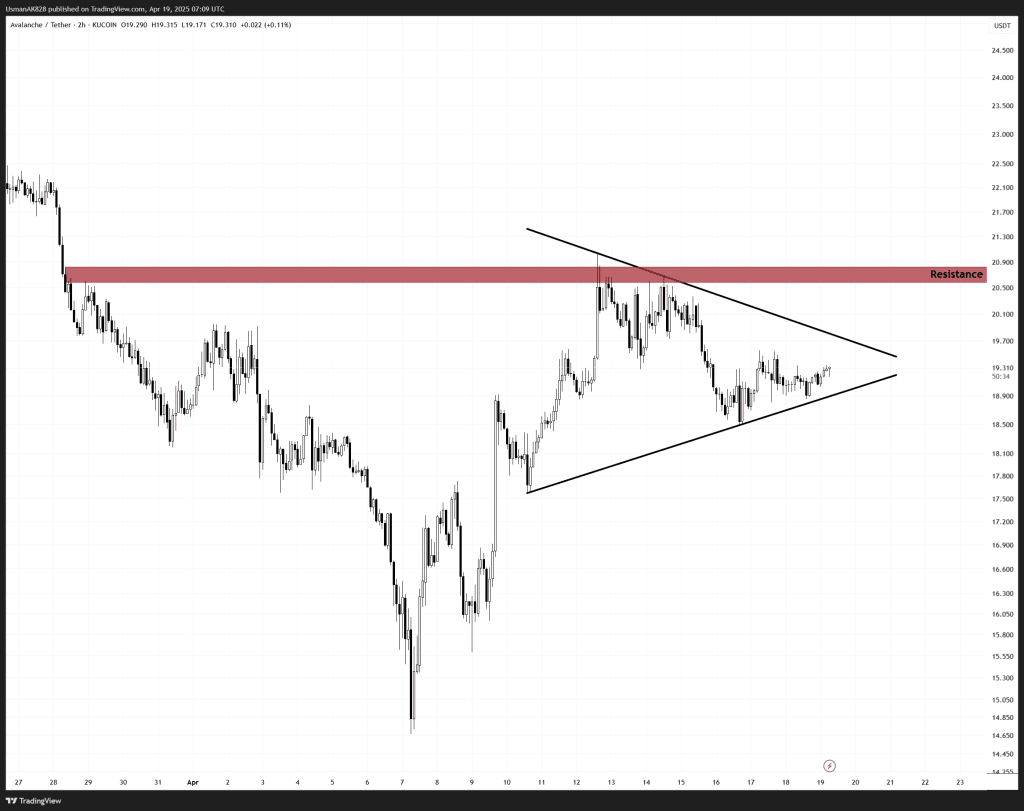
AVAX is in a lower time-frame symmetrical triangle. Source: TradingView
General View
AVAX is showing signs of strength after bouncing from its recent lows, with price now trading inside a symmetrical triangle on the lower time frame. The pattern has increased significance as it is appearing near the base of a larger falling wedge, signaling a potential continuation. The series of higher lows suggests that bulls are quietly regaining control, absorbing supply at each dip, lining up for a breakout.
On The Upside
Both breakout points align at the same point, at the $19.70 level. This is going to be an all-important level for the Bulls. A confirmed breakout above this barrier could trigger a strong rally higher initially towards the $20.80 level, which is another key resistance zone.
On The Downside
The immediate support for AVAX sits at $18.90. This is the trendline support that has been getting honored for the last few hours. If this trendline level fails, a short-term drop would be on cards aimed towards $18.10, followed by 17.50 next.
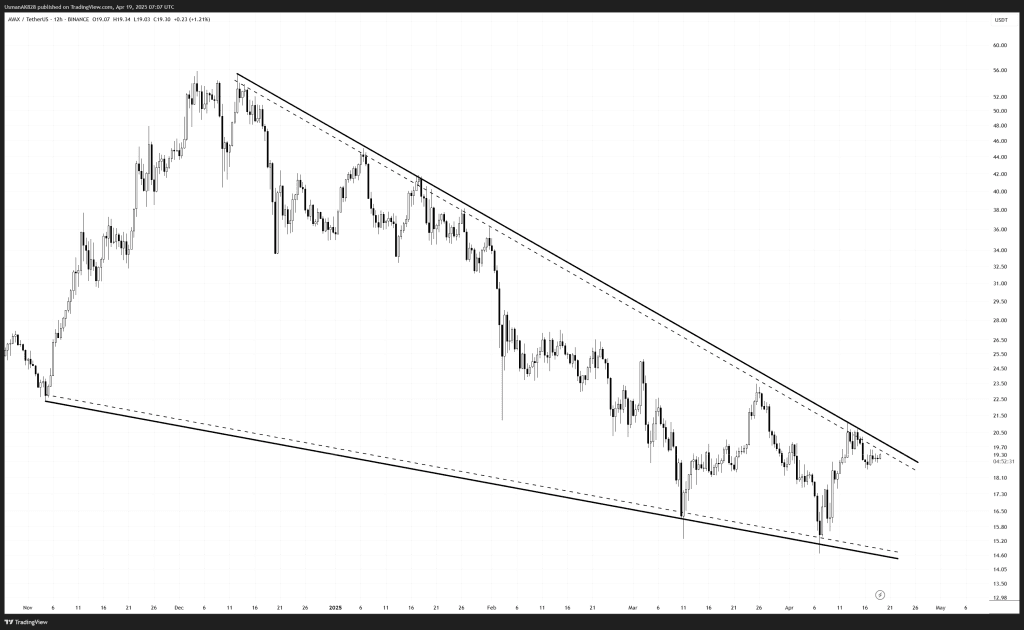
Falling wedge breakout getting closer for AVAX. Source: TradingView


