


AVAX Technical Analysis: 9 APR 2025
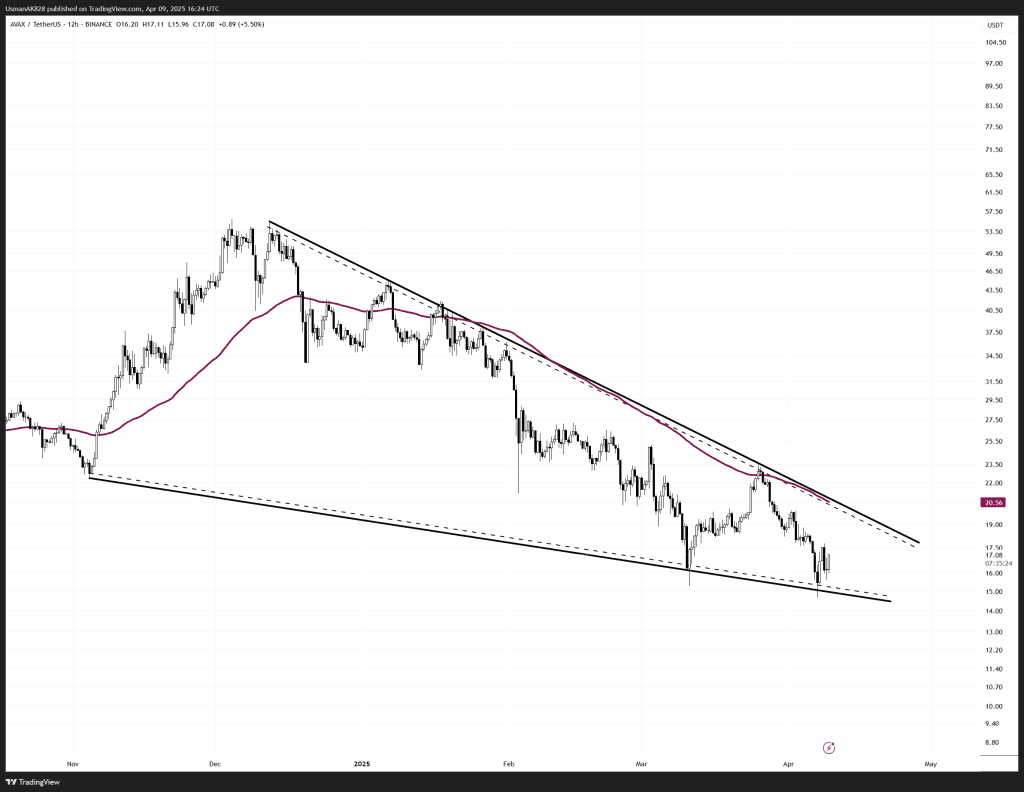
AVAX is in a falling wedge pattern! Source: TradingView
General View
AVAX remains trapped inside a well-defined descending wedge, continuing to respect both upper and lower boundaries since late 2024. While the medium-term structure still favors bears, the lower bound of the wedge is once again acting as a demand zone. More importantly, oscillators are beginning to flash early signs of bullish divergence, hinting at potential exhaustion in the recent downtrend. However, unless AVAX convincingly breaks above the EMA and the upper trendline resistance, rallies are likely to be short-lived.
On The Upside
A reclaim above $17.60 to $18.20 could act as the first signal of strength. Although price is expected to face challenge around this zone, if bulls succeed in overwhelming the bearish pressure, they are likely to open a good upside corrective wave which can even take price higher towards $22.50 levels.
On The Downside
AVAX currently is starting to take stronger supports with each fall. Similarly, that is being confirmed by the oscillating indicators as well, which is a sign of relief for the bulls. As for the session, there is intra-day support at 16.80, followed by 16.25 levels. As long as AVAX holds the 15.30 level, further downside chances are starting to fall.
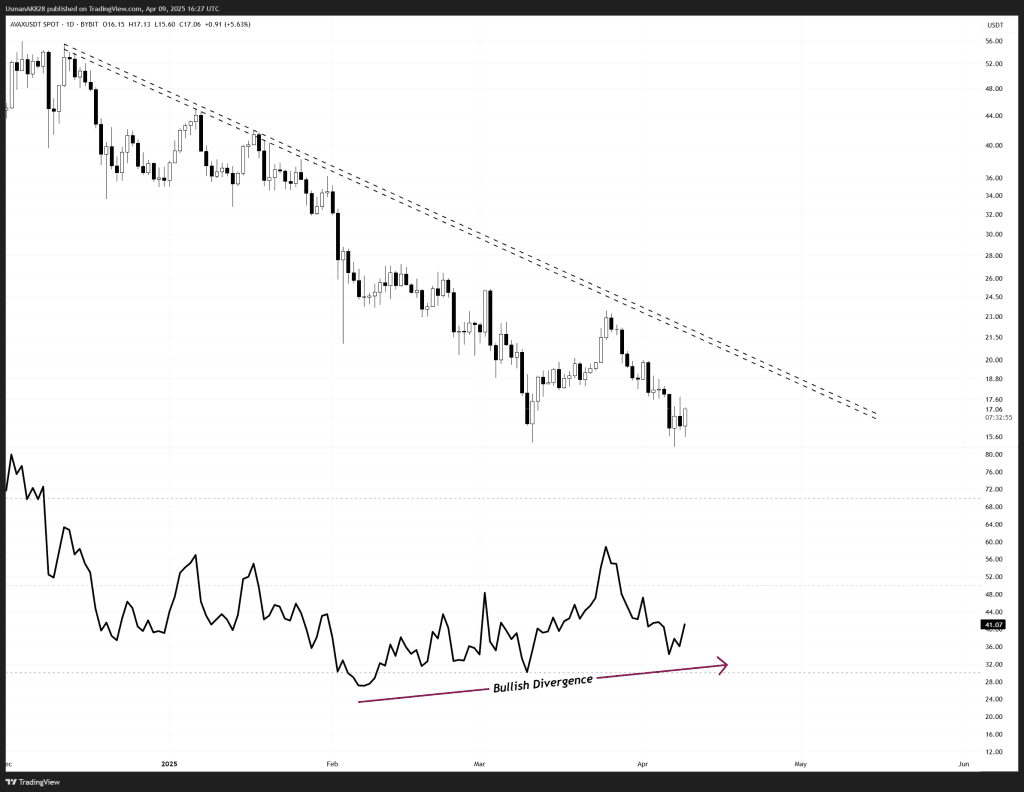
AVAX is starting to print complex bullish divergence! Source: TradingView


