Bitcoin Technical Analysis: 13 MAR 2025

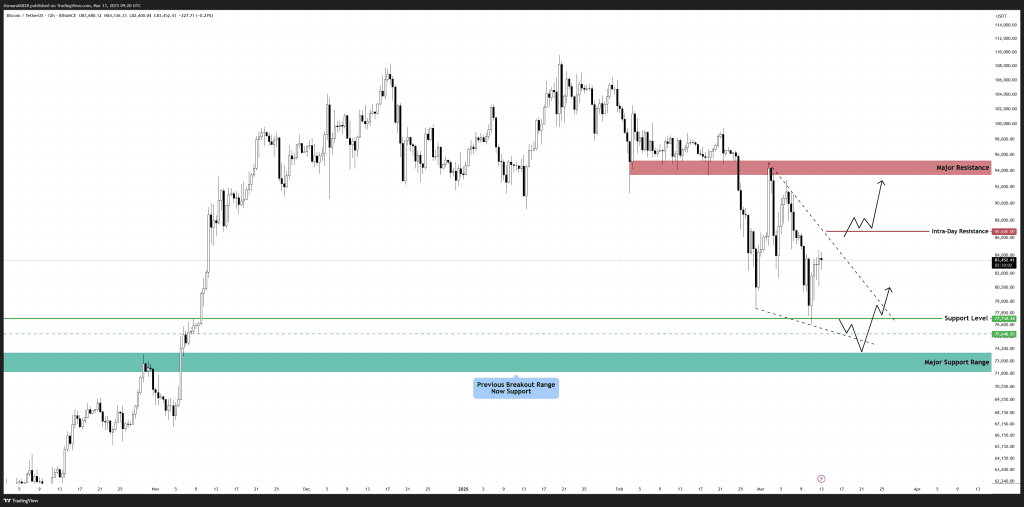
Bitcoin is establishing a falling wedge pattern. Source: TradingView
General View
Bitcoin has been in a corrective phase after experiencing a significant drop from its previous highs. However, the price has rebounded from the key support levels following an aggressive sell-off, showing some early signs of recovery. The corrective structure is gradually forming a falling wedge, a pattern that often precedes bullish reversals, and if buyers can maintain momentum and hold above the key supports, Bitcoin could gain strength for a broader reversal. However, the trend for now remains fragile, and failure to sustain the supports may invite fresh intra-day selling pressure.
On the Upside
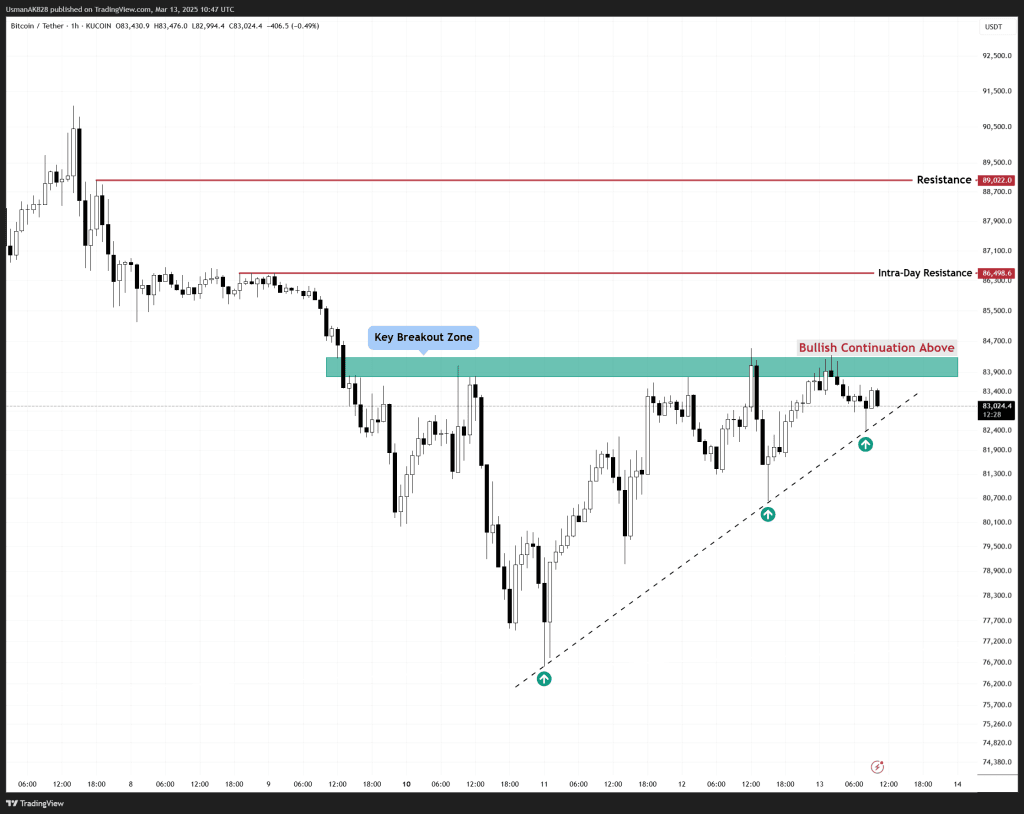
Bitcoin faces primary intra-day resistance at the $84,500 level. A breakout above this resistance level would push the price towards the next intra-day resistance at the $86,680 level. This is where some congestion is expected, making it a challenging level for the bulls. The price would need to overcome this intra-day resistance at $86,680 to confirm short-term strength. A stronghold above this level potentially opens the upside towards the $88,000 to $90,000 levels. This is where strong profit-taking is expected for the session.
On the Downside
Several supports are now starting to form, creating a favorable structure for the bulls. Additionally, the daily time-frame RSI is printing a bullish divergence, which further reinforces the recovery perspective going forward. As of now, the $80,050 level is established as a strong support level. Following this level, the price has additional supports positioned at the $77,250 to $75,650 zone. This region has lately been providing strong favorable reactions and is expected to do the same if tested again.

Bullish continuation stands above $84,400. Source: TradingView