


- Bitcoin flashed a TD Sequential “9” buy signal near the $74,500 support, hinting at a possible bullish reversal in price action.
- Whale transactions over $1M surged as BTC rallied to $81,200, historically signaling strong upcoming market trends.
- Despite recent gains, BTC faces key resistance at $82K; failure could send prices below $74,500 toward the $70K support zone.
Bitcoin breached the $80,000 mark as the broader market slippage intensified. However, a recent onchain trend has triggered suggestions of a potential price recovery for BTC. Crypto expert Ali Martinez drew attention to an interesting trend in the past day: as Bitcoin rallied from $74,500 to the $81,200 mark, large transactions totalling over 1 million were conducted on the network.
Historically, these large movements serve as a precursor to a significant market trend. As such, market commentators believe this recent data from Santiment could hint at a possible BTC price comeback.
TD Buy Signal and Fibonacci Support Point to BTC Rebound
Bitcoin is changing hands at $78,592 following a modest slip in the recent intraday market. In that period, the trading volume declined by nearly 50% as traders showed less interest in BTC’s price movement.
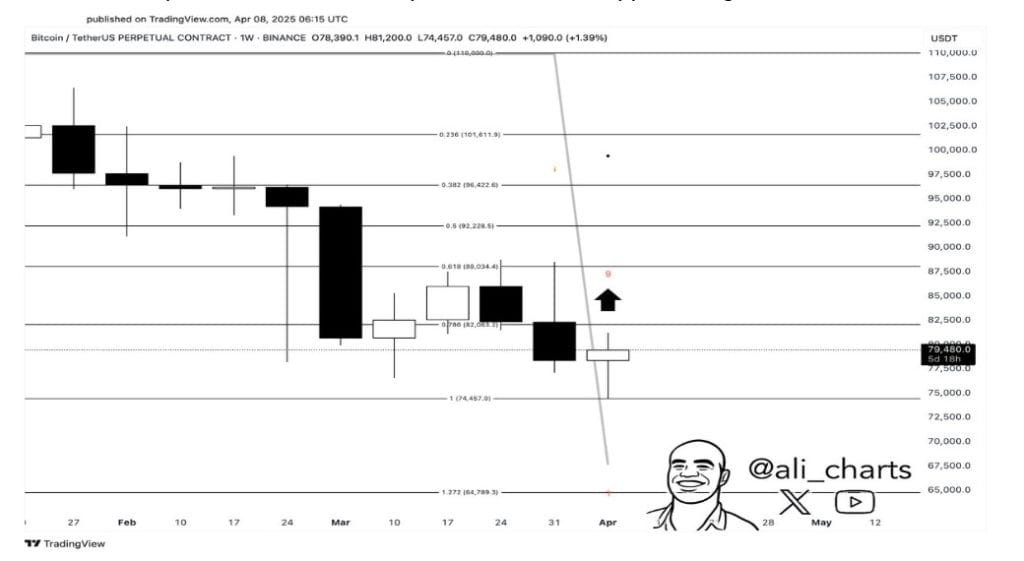
BTC’s 7-day chart posted by Ali shows that a potential bullish reversal could be on the cards. As shown in the chart, Bitcoin flashed a “9” buy signal on the TD Sequential technical indicator. This count often suggests the end of southbound movement and a possible uptrend.
In line with the above context, Bitcoin slipped to the $74,500 bottom before beginning an upward movement. This price surge took place around the Fibonacci 1.0 support level of $74,457. The price is now heading towards the $82,000 key resistance point at the 0.786 Fibonacci retracement level.
If a breakout happens at this level, it could confirm the TD Sequential signal and pave the way for a move toward $88,000. A combination of the “9” buy signal, price bounce, and strategic whale transactions typically indicates promising movements.
Bitcoin Nears Key Resistance Amid Bearish Sentiment
Bitcoin has witnessed 15 green trading outings in the past month. Additionally, it has gained 9% over the past year and outperformed crypto assets in that period. However, experts remain cautious as the cryptocurrency trades below the 200-day SMA, which signals a bearish sentiment in the long term. The current BTC market outlook remains bearish and is amplified by the extreme Fear sentiment of market participants.
In the past four months, Bitcoin has alternated below the descending trend line. This trendline acts as resistance and shows that selling pressure is high even as the price decreases. At present, BTC’s current price seems to be approaching this trendline.
According to analysts, this could form a baseline for price movements in the medium term. Each time Bitcoin hit this line in the past, sellers have always stepped in and tanked the price. A repeat of this trend could further push Bitcoin to lower price levels.
The Fibonacci levels in the chart above show possible price targets in case of a potential upward trend. If Bitcoin breaks $82,003, it will head towards the $88,034 mark. Further breaks could target $90,000 and potentially $92,228.
However, if sellers appear at this trendline, BTC could slip to lower support levels. In this case, it could slip below $74,500 and travel down to the $70,000 mark.


