- BNB shows weakening momentum with declining CVD and volume, signaling bearish trends.
- A close below the 0.5 Fibonacci level could confirm a further downside for BNB.
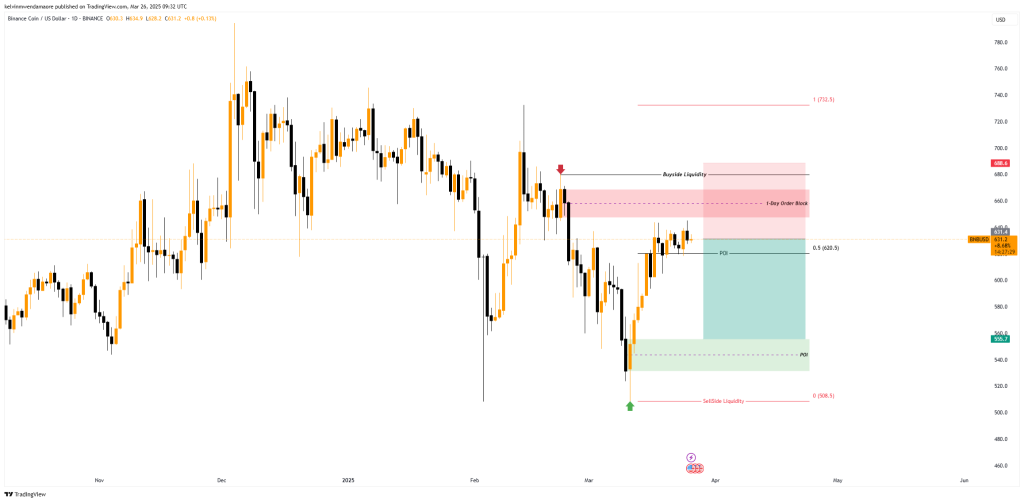
- BNB faces resistance at $688.6, with $555.7 as the next support if the downtrend continues.
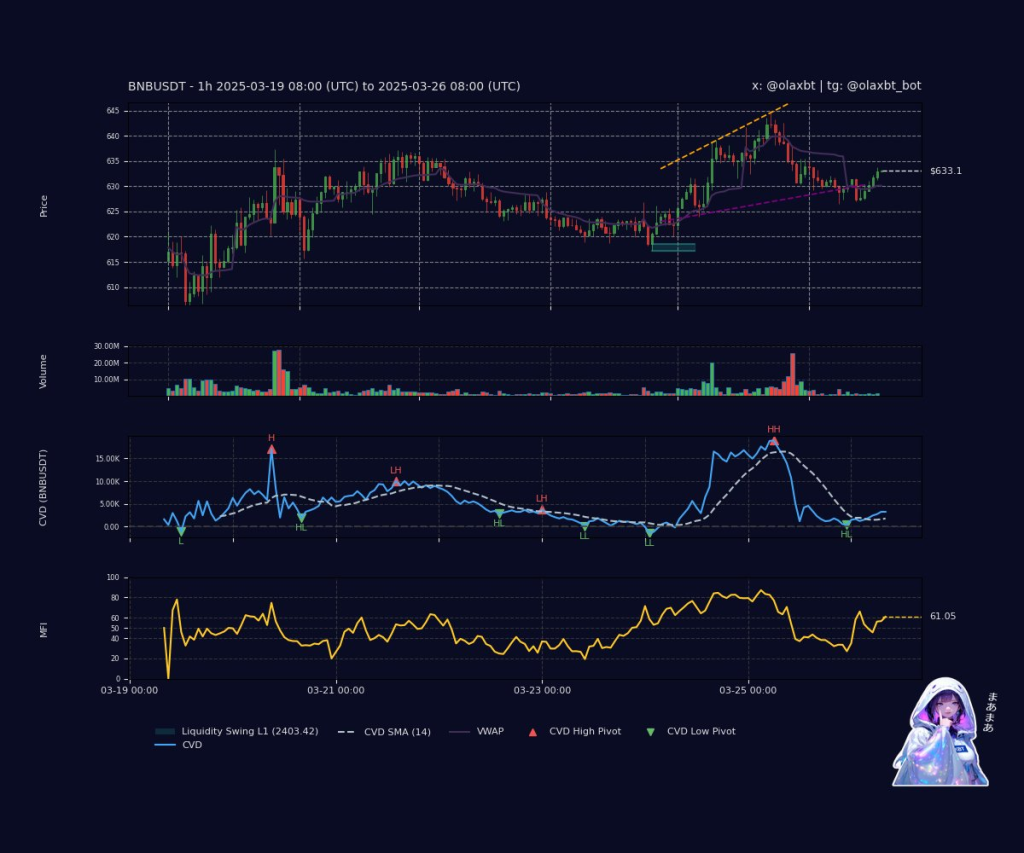
According to market expert Olaxbt’s latest analysis, the price of the BNB/USDT pair has been experiencing a steady downtrend since the price topped the $645 level. Based on the analyst, the market is downbeat, suggesting an exhaustion phase is at play. As price fades and volume dies off, future pressure for BNB may go downward.
Key Technical Indicators Suggest Weakening Momentum
The analyst’s chart shows BNB’s price from March 19 to March 26, 2025, which had an initial snowball effect until it reached $645. Yet, following the peak, the price retreated from the previous highs to $633.1. To support this shift, Olaxbt used the Cumulative Volume Delta (CVD) indicator, which measures the accumulation or exhaustion of buying or selling pressure.

The CVD indicator at this point shows a clear divergence, as buying pressure has waned since the prior week. The red pivots of the CVD highs are consistent with the drop, meaning there is almost no buying pressure. As OlaxBt has noted, such a scenario hints that a bearish trend is possible if volume does not bounce up.
Additionally, the chart shows that the CVD indicator peaked at 15,000 contracts on 19 March and has declined since then, indicating the absence of fresh buying support. Along with the drop in CVD, MFI also cooled. This is an indicator of money flow into and out of an asset, and a falling MFI means that the investor’s excitement has begun to wane.
According to Olaxbt’s analysis, market sentiment seemed to lose steam then, as MFI peaked near 100 close to the beginning of the week but dropped afterward. At press time, the MFI reading of 61.05 suggests that market participants are less likely to push prices further up.
The volume chart further emphasizes the decreasing interest in BNB, as the bars show lower activity levels than previous surges. The overall volume has been tapering off, which could signal that traders are losing confidence in the upward trend. The price action and declining volume suggest that the market might soon experience more consolidation or a potential downtrend.
BNB Key Levels to Watch
BNB recently seems to continue with the bearish trend. Key levels that would bear this out are as follows:
- The one-day chart analysis has drawn out important buy-side liquidity at $688.6 and sell-side liquidity at $508.5. These are areas where large market players can push prices in either direction, making them essential for price prediction zones.

- Not to be left out, the Fibonacci retracement tool is involved in a great deal of the analysis, with the 0.5 Fibonacci level at $620.5 playing a key role as a support zone. However, a full candle close below this level would show that the market structure has shifted, implying that the bullish trend is over and that the declines should continue.
- An order block is an equally important concept in this analysis. An order block is a price zone where institutional traders place large buy or sell orders. Currently, the one-day order block at $688.9-$647.5 is acting as resistance, and falling short of breaking it and bouncing off it could set the tone for a bearish move.
Given these market conditions, BNB has room for more downside from the current levels, especially if it falls below the 0.5 Fibonacci level and fails to hold $620.5 as support. In that case, the next possible support area could be $555.7.