


BNB Technical Analysis: 30 APR 2025

BNB is inside a descending triangle pattern. Source: TradingView
General View
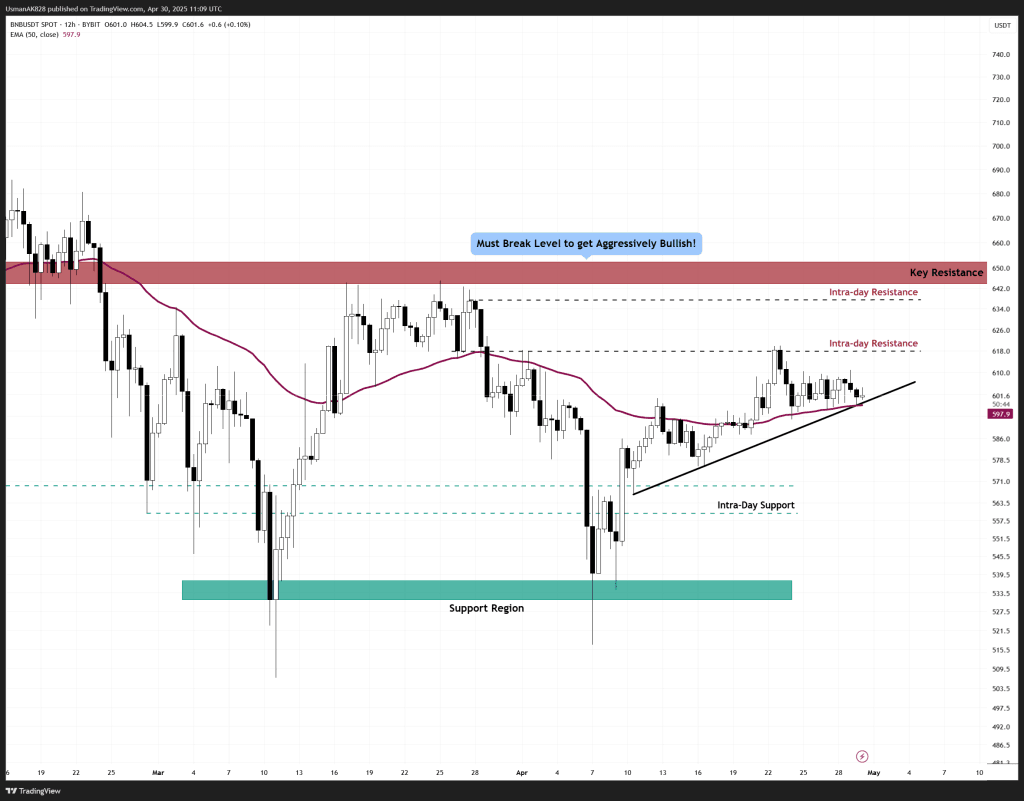
BNB has seen a steady recovery in recent weeks, gradually pushing higher and reclaiming the $600 psychological level. Price has recently been holding off the ascending trendline, however, the momentum is now signalling a slowdown. On the lower timeframes, price appears to be forming a descending triangle, a typically bearish setup that may pressure the current uptrend if buyers lose further momentum. For now, the bias remains cautiously optimistic, but a breakout is needed soon to avoid downside risk.
On The Upside
If bulls maintain support at the rising trendline and reclaim the $618 mark, momentum could quickly accelerate toward $630 to $642. However, we have seen that BNB has continuously been getting rejections from that $618 level. Unless that breaks, any further upside looks limited.
On The Downside
Failure to break $618 and a loss of the ascending trendline at $597 would be a negative development for the session. This would likely drag BNB further lower towards $580 and potentially $565. Additionally, at $597, there is support from EMA-50 as well, which has been holding the trend for some time now.
Price continues to struggle off the intra-day resistance level. Source: TradingView


