BNB Technical Analysis: 19 APR 2025

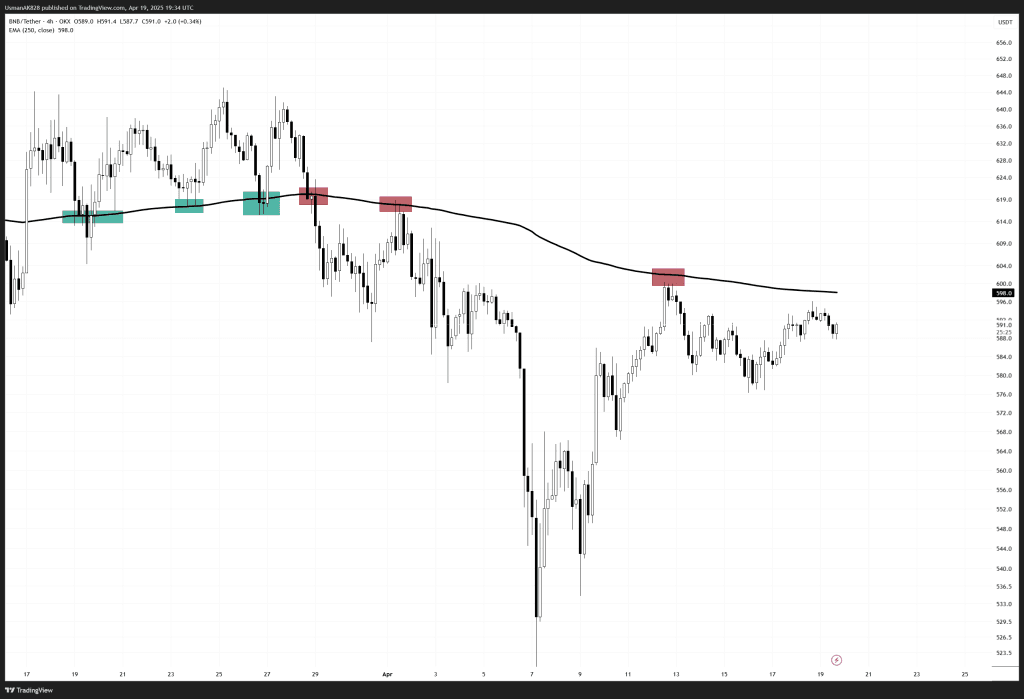
BNB price chart for 19th April 2025. Source: TradingView
General View
BNB has shown notable recovery in recent days after breaking out of the falling wedge, which gave bulls a momentary boost. However, despite the breakout, the move has stalled after price once again came closer to the dynamic resistance from the EMA-250. This level has been offering reliable support since March 17th, flipped into a strong resistance after March 28th, and continues to cap upside attempts.
On The Upside
For BNB, $599 is a major hurdle. Price has been unable to break past this level since early April 2025. A decisive close above $599 would open fresh upside potential for BNB, in which price has the capacity to even aim for the $615 to $620 hard resistance zone.
On The Downside
Failure to break through $599 keeps the momentum tilted in favor of the bears. Immediate short-term intra-day support continues to position itself around the $585 level. As long as this level holds, bulls will have the chance to exercise their strength, as a break below this slightly increases the selling potentials.

The 4-hourly EMA-250 is putting bulls in a tough spot. Source: TradingView