


Solana Technical Analysis: 31 MAR 2025
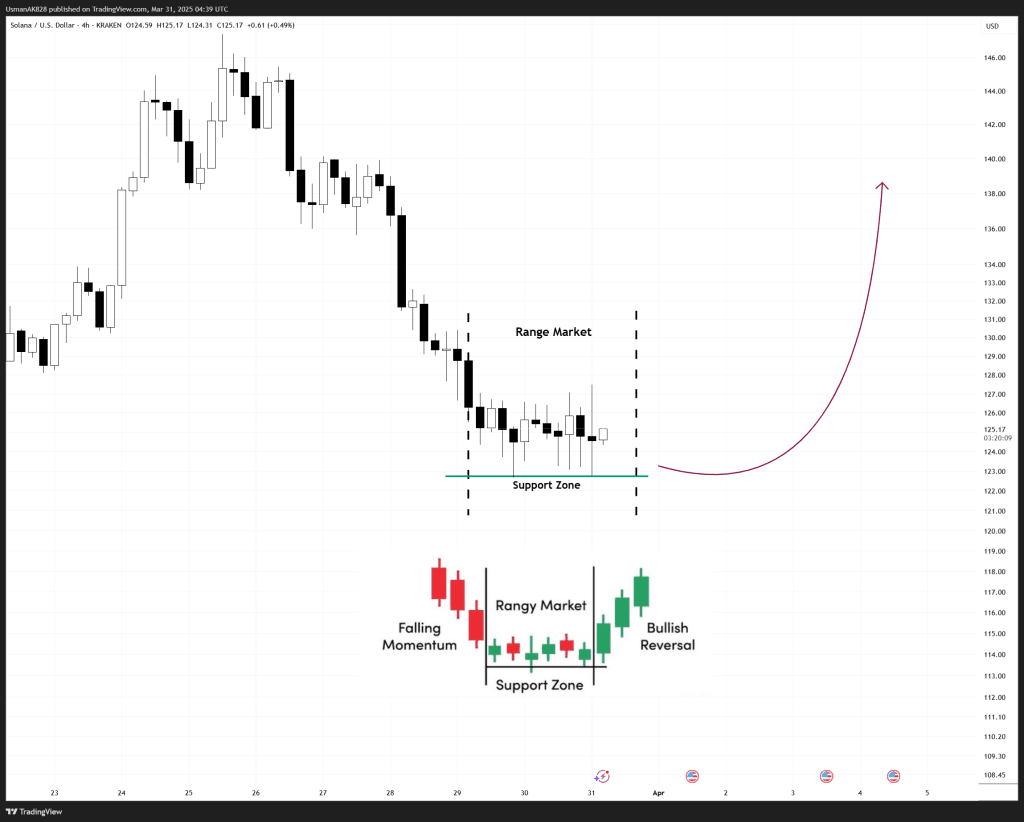
Solana establishing a bullish checkmate candlestick pattern. Source: TradingView
General View
Solana has been in a steep downtrend but is now showing early signs of a potential reversal. The price is stabilizing within a key support range, and a Bullish Checkmate candlestick pattern is emerging. This is historically a reliable formation for trend reversals. This, combined with the formation of a falling wedge, strengthens the case for a potential bullish turnaround.
On The Upside
The first major resistance for the session lies at the levels of $126–$127, where previous rejection points exist. A breakout above this could trigger short-coverings, which would extend the rally further towards $130–$133, aligning with the upper boundary of the falling wedge.
On The Downside
Despite bullish signs, downside risks remain if the $122–$120 support zone fails to hold. A breakdown below this area would invalidate the short-term bullish outlook, potentially driving Solana towards $115, with further downside risks extending to $110.
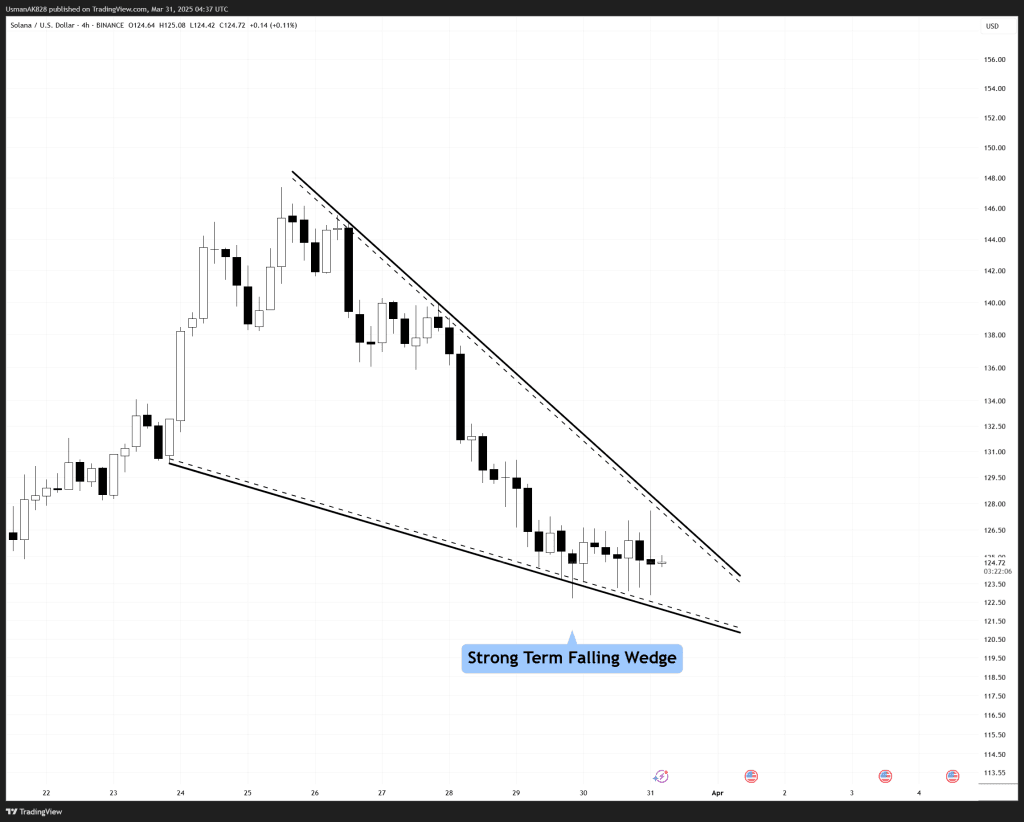
Price inside a falling wedge pattern. Source: TradingView


