


Ethereum Technical Analysis: 6 APR 2025
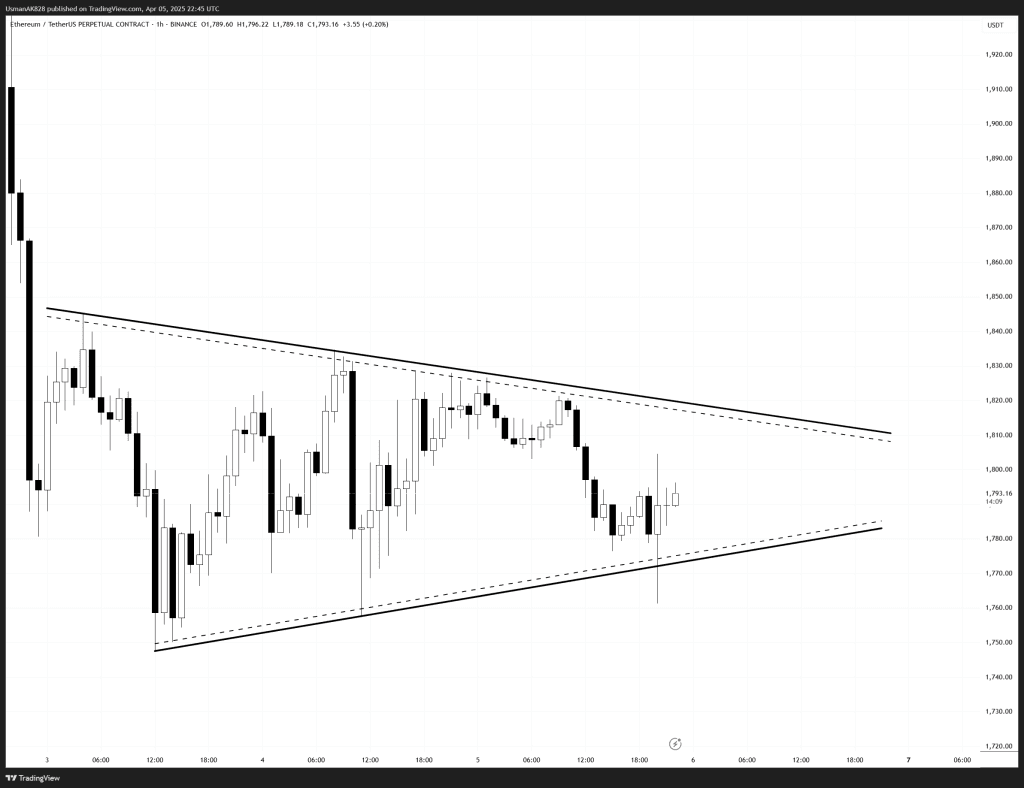
Ethereum’s 1-hour time-frame showing a triangle pattern. Source: TradingView
General View
Ethereum is currently consolidating inside a symmetrical triangle pattern, signaling a period of indecision as price holds onto lower support levels. With the structure tightening, the market appears to be preparing for a directional move. Additionally, an active CME gap remains unfilled at higher levels near $1816, which could act as a short-term price magnet if bullish momentum builds in the coming hours.
On The Upside
The active CME gap sits just above the triangle’s upper boundary, adding to the significance of this zone as a short-term resistance. Price is likely to knock for a breakout of this resistance. If bulls gain a sustainable breakout, Ethereum may retest $1840 and potentially stretch to $1865.
On The Downside
Ethereum continues to print higher lows inside the triangle structure. However, if the price slips below the ascending trendline support and is currently sitting near $1775. If this level gets breached, Ethereum will then slide back to the $1750 support level. However, this time, whether this support holds remains in question as multiple attempts have been made at this level, which could likely weaken it.
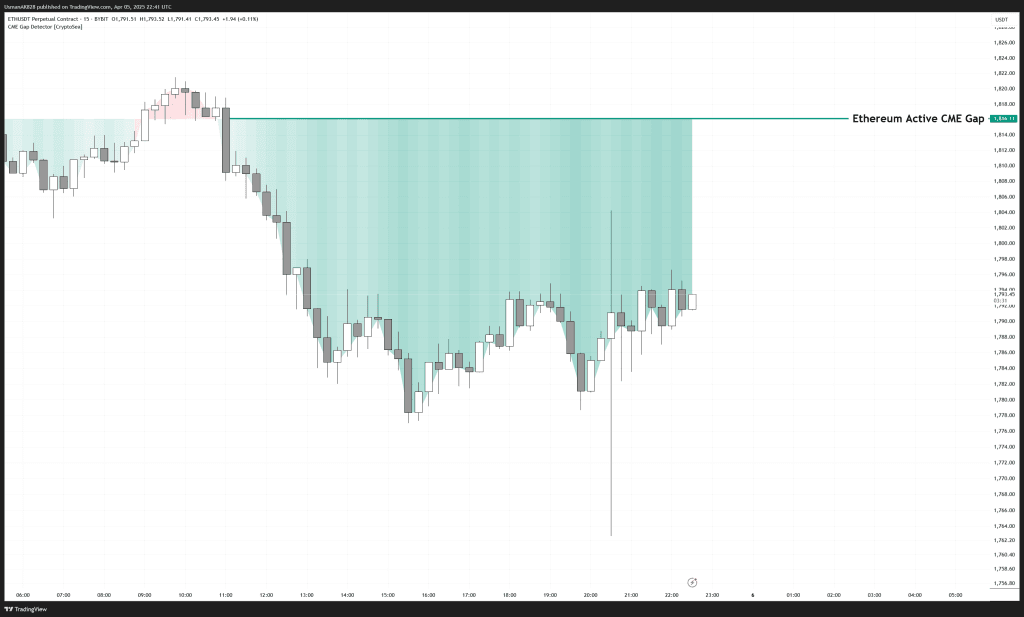
Ethereum’s active CME gap open till $1816. Source: TradingView


