


BNB Technical Analysis: 10 APR 2025
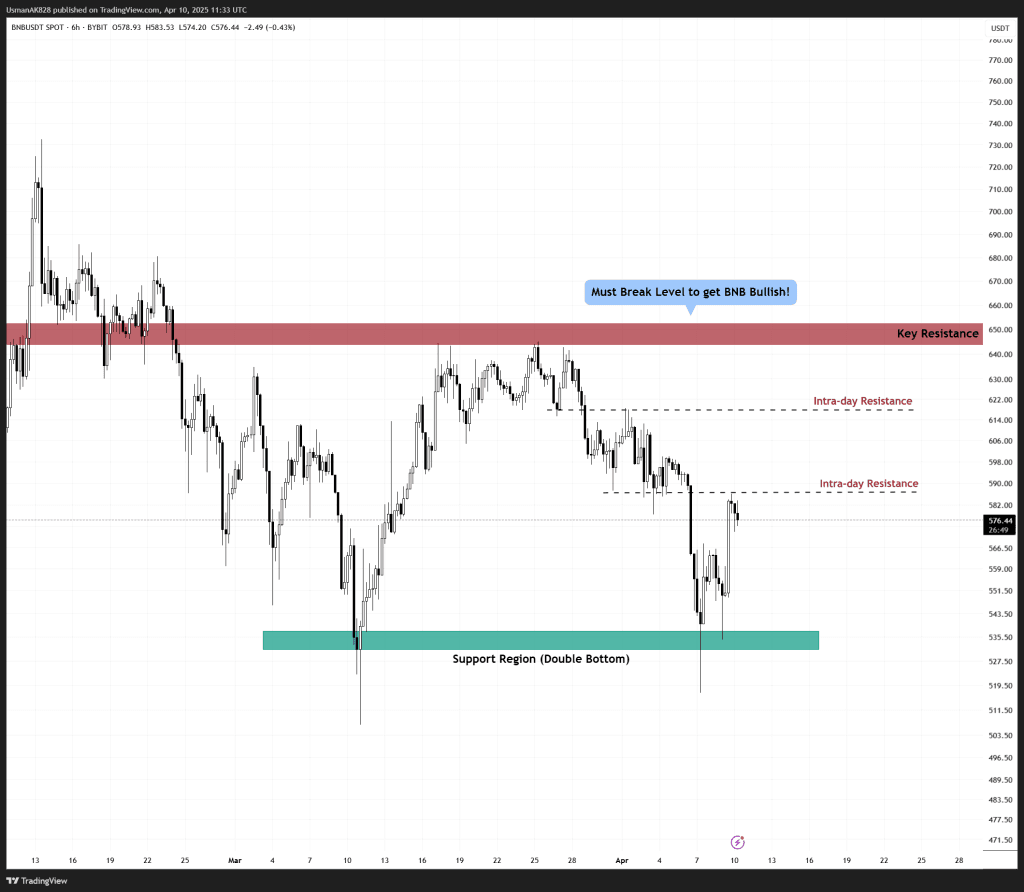
Potential double bottom pattern appearing on 6-hour time-frame. Source: TradingView
General View
BNB has shown signs of recovery after the recent sharp sell-off. The price is currently trading just beneath descending trendline resistance while holding above a key short-term support band. More importantly, a potential double bottom formation is beginning to take shape on the medium timeframes. However, this pattern still awaits confirmation, specifically, a breakout above the neckline resistance. This neckline not only represents the structure’s breakout point but also serves as a pivotal level. Breaking and holding above it is a compulsion if bulls are to reclaim control from the sellers.
On The Upside
The immediate resistance lies at the descending trendline around $585. A clean breakout above this level, especially with increasing volume, could open the door for a bullish continuation toward $595 and potentially $615. Both these are intra-day resistances that can be challenging for the bulls.
On The Downside
If BNB fails to break the trendline and falls back below the $568–$564 support zone, the structure will weaken again. A breakdown below this level would not only erase the recent recovery but also risk revisiting the ascending support line near $550. Any failure to defend this rising trendline would expose BNB to its recent lows and extend the bearish pressure for the short term.
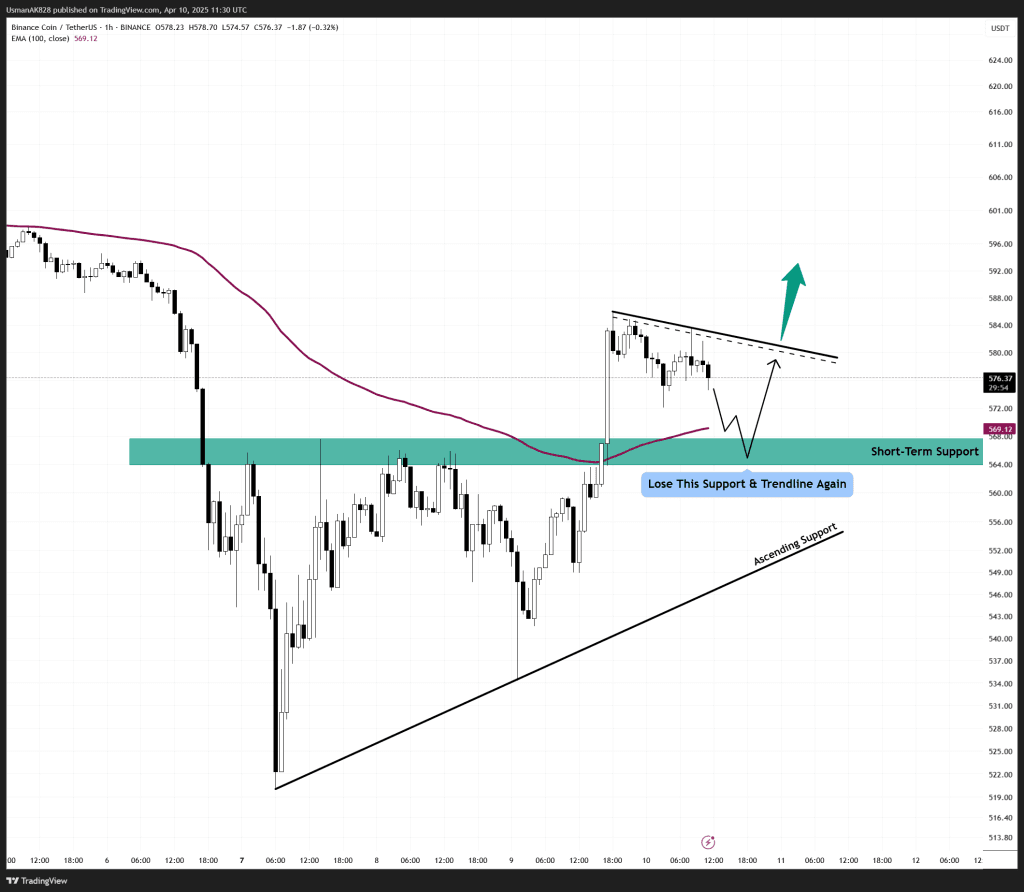
BNB is likely to see increased volatility over the coming hours. Source: TradingView


