


Ethereum Technical Analysis: 30 APR 2025
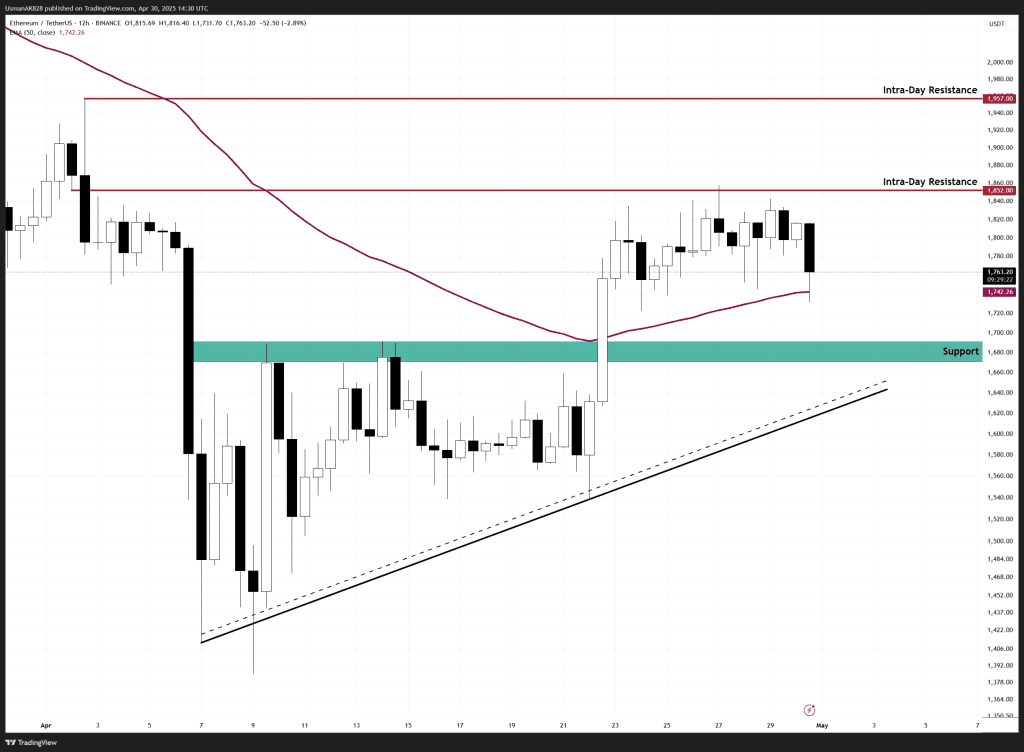
Ethereum has negated the bullish flag formation. Source: TradingView
General View
Ethereum has managed to climb steadily in recent days, reclaiming the key $1700 to $1750 region and holding above the 50 EMA for now. The bullish momentum had been gradually building, but RSI recently took a beating from the 65–70 zone, triggering an immediate intraday sell-off, which is currently negating the bullish flag formation as well. While bulls have kept price above the prior resistance-turned-support zone, the reaction suggests waning strength. If buyers can maintain support above the 50 EMA and defend the broader uptrend structure, Ethereum still has room for further upside, but its confidence is starting to drop.
On The Upside
Ethereum on a lower time frame has established several intra-day resistances. The primary level of resistance is observed at the $1780 level, followed by the $1800 level. If price finds acceptance above $1800, only then will the upside stretch higher towards $$1825 to $1850 again.
On The Downside
The immediate concern is the failure to sustain higher levels after the RSI rejection, which may affect the short-term sentiment. Currently, Ethereum remains exposed towards the $1740 level where the EMA-50 is present. If this is breached, the price is likely to retest the strong support zone between the $1700 to $1680 levels.
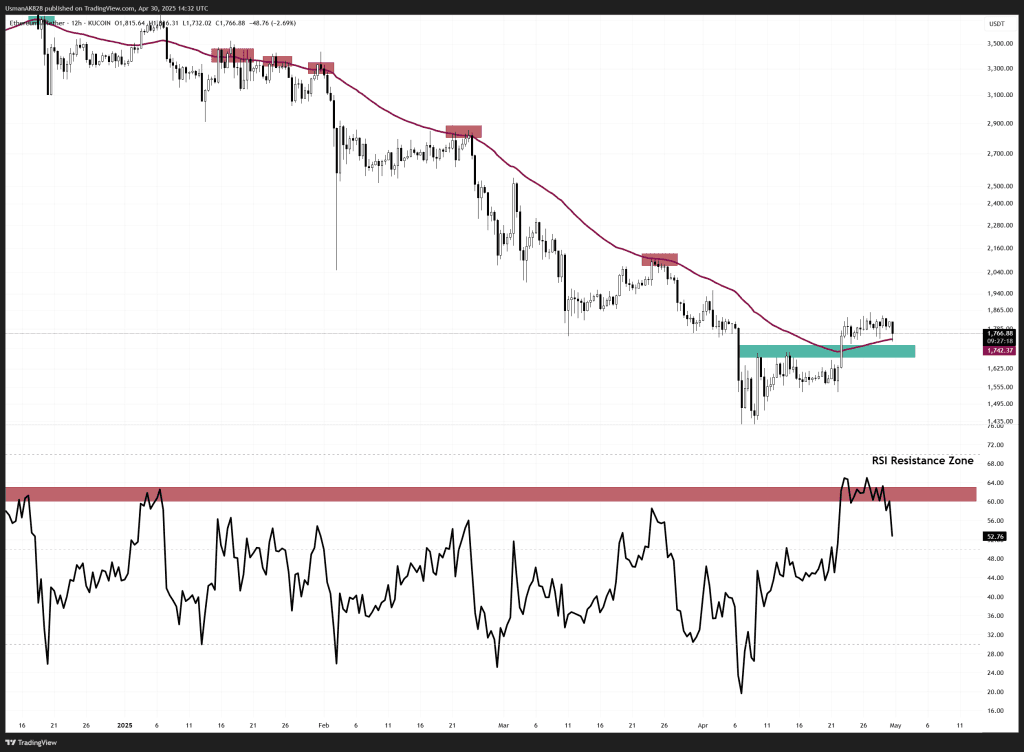
EMA-50 is starting to be tested once again. Source: TradingView


