


Ethereum Technical Analysis: 27 APR 2025
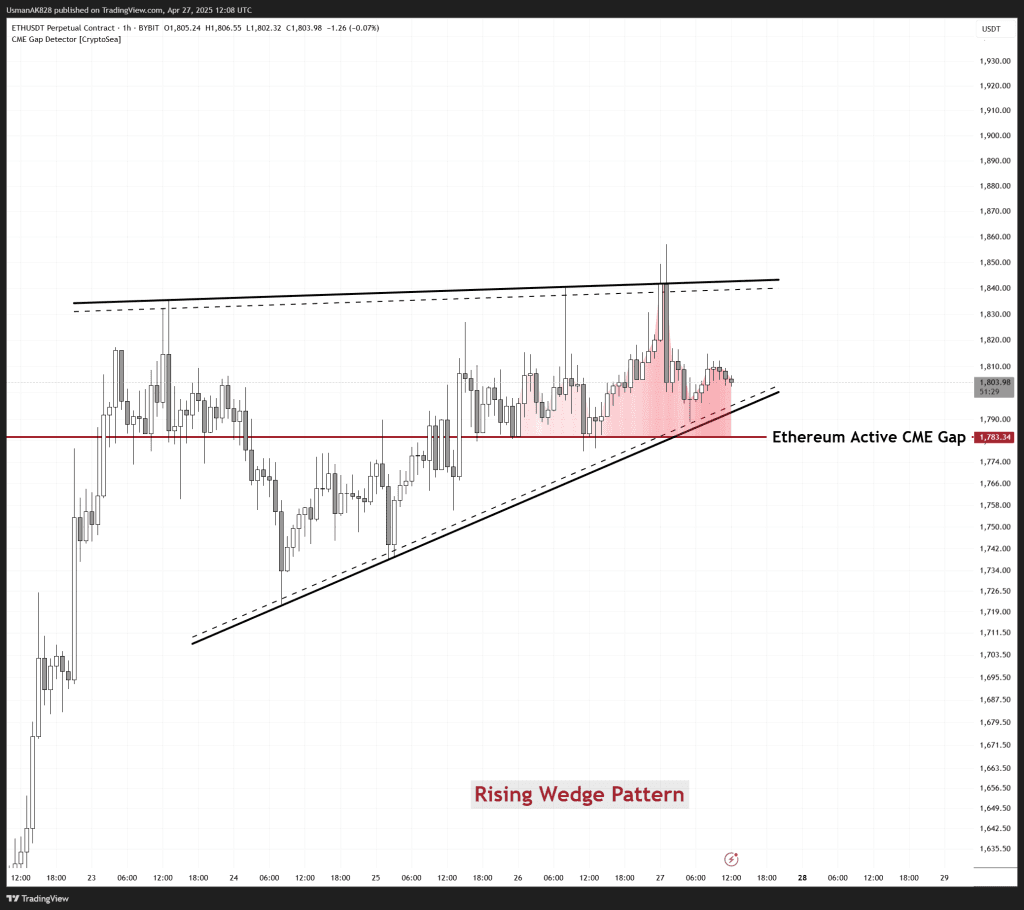
Ethereum is starting to establish a rising wedge pattern. Source: TradingView
General View
Ethereum’s last few sessions have been very strong. It is currently pushing higher and holding above key support levels. After breaking out of an ascending triangle, price action has now transitioned into a tightening consolidation, forming a bull flag on one hand and a rising wedge on the other. However, while bulls are currently in control, the presence of the wedge pattern hints at possible volatility ahead. The 12-hour EMA-50 is providing dynamic support for the first time in 2025, signaling a potential shift in trend strength.
On The Upside
If bulls can find some acceptance above $1815, the price can then push for the $1842 trendline resistance level. If the price is to push upwards in a more trending manner, it needs to negate the rising wedge pattern. Ethereum could then quickly extend its rally towards the next intra-day resistance at $1,920.
On The Downside
If Ethereum fails to hold the lower support of the wedge near $1795, the price is likely to slide lower initially into the active CME gap zone towards $1885 to $1880 levels. This is where some intra-day support is likely to appear, which can cause a potential round of short-covering.
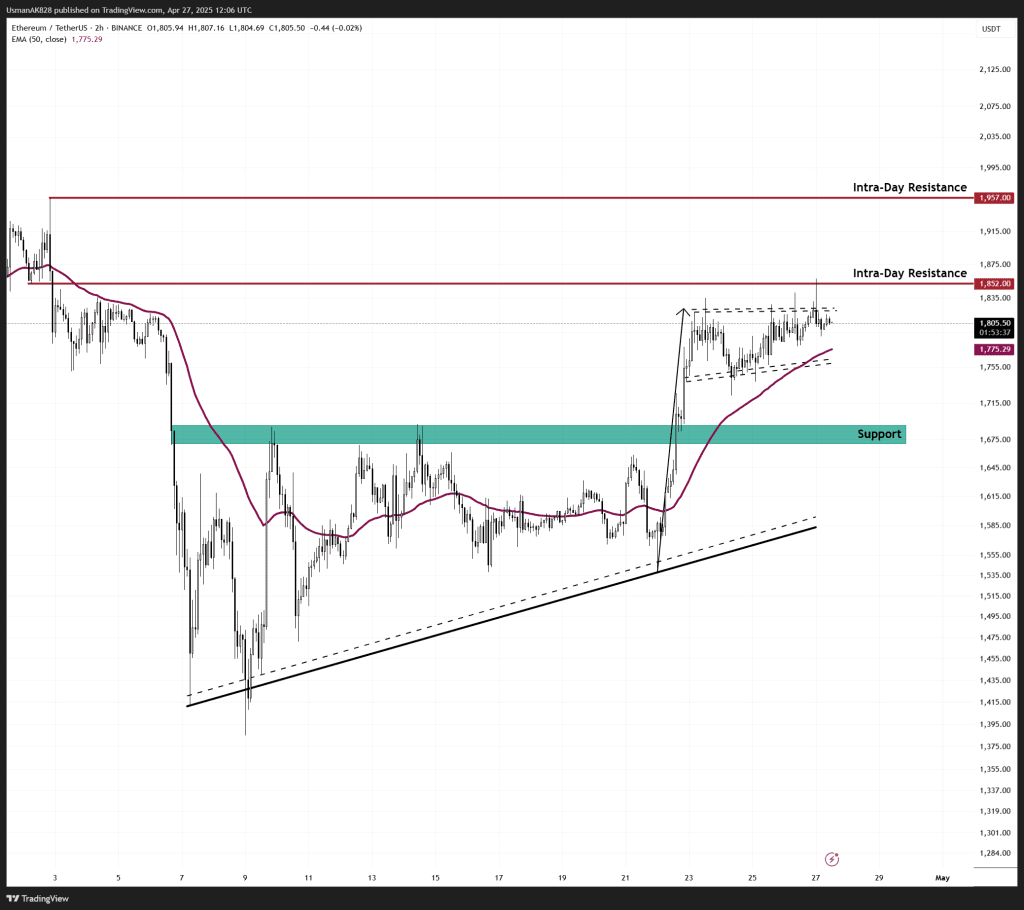
Ethereum on the bullish side is holding above EMA-50 on 2-hour time frame. Source: TradingView


