Ethereum Technical Analysis: 13 MAR 2025

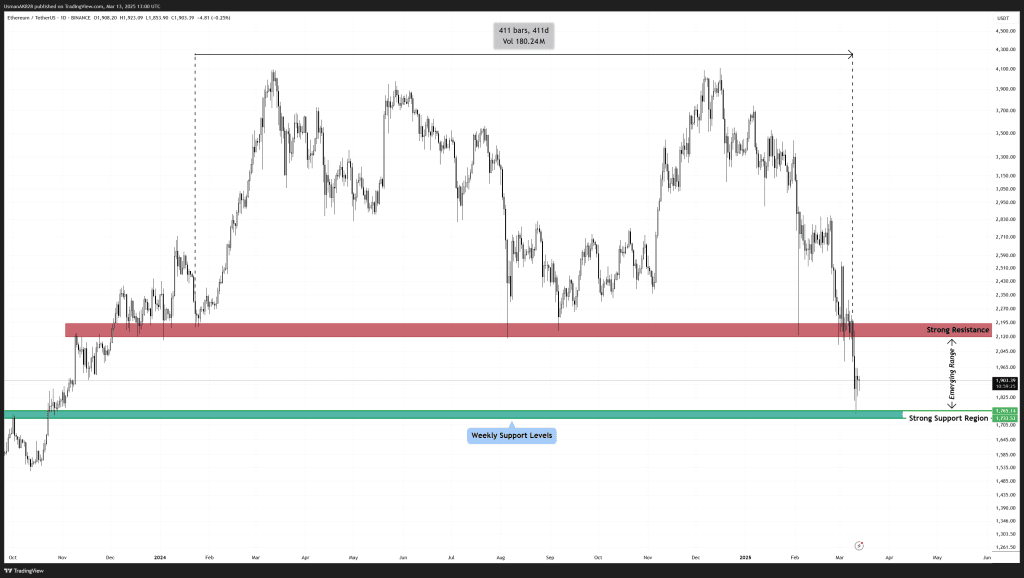
Ethereum trapped inside key S/R levels. Source: TradingView
General View
Ethereum is currently trading at levels last seen in late 2023. Ethereum only managed to have a single strong quarter back in 2024; since then, it has been under persistent selling pressure. Ethereum recently lost a range that had been held since December 2023 and is now hitting some important levels.
On the Upside
On the upside, several strong resistances are likely to make things difficult for the bulls. However, Ethereum’s high short exposure could create a short-squeeze reaction, leading to a quick bounce back into 2280 to 2320 resistance levels. These were previously major support levels and will now function as key resistance zones. Meanwhile, for the short-term, bulls need to break the 1960 level to be able to push higher into the 2000 mark and potentially 2140. Ethereum is likely to face continued partial profit-taking pressure at resistance levels.
On the Downside
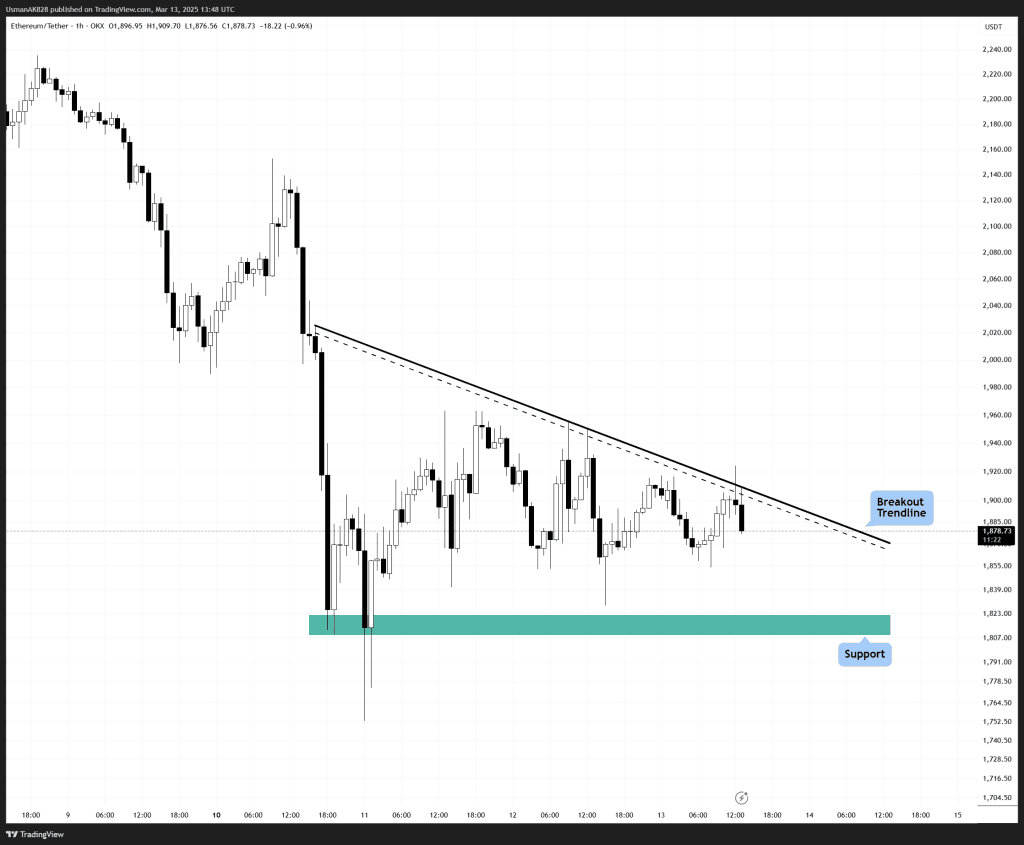
Price is now entering a range of weekly supports that are going to offer some strong supports now as well. Initially there are lower time frame supports established at 1880 and 1840 levels. These levels are holding fairly strong as of now; however, if any strong selling is witnessed, Ethereum can once again slide to its weekly support levels between 1765 and 1720. These are some levels that won’t be easy to break, even for the sellers who still hold an edge over bulls

Ethereum is in a converging triangle pattern. Source: TradingView