Ethereum Technical Analysis: 4 APR 2025

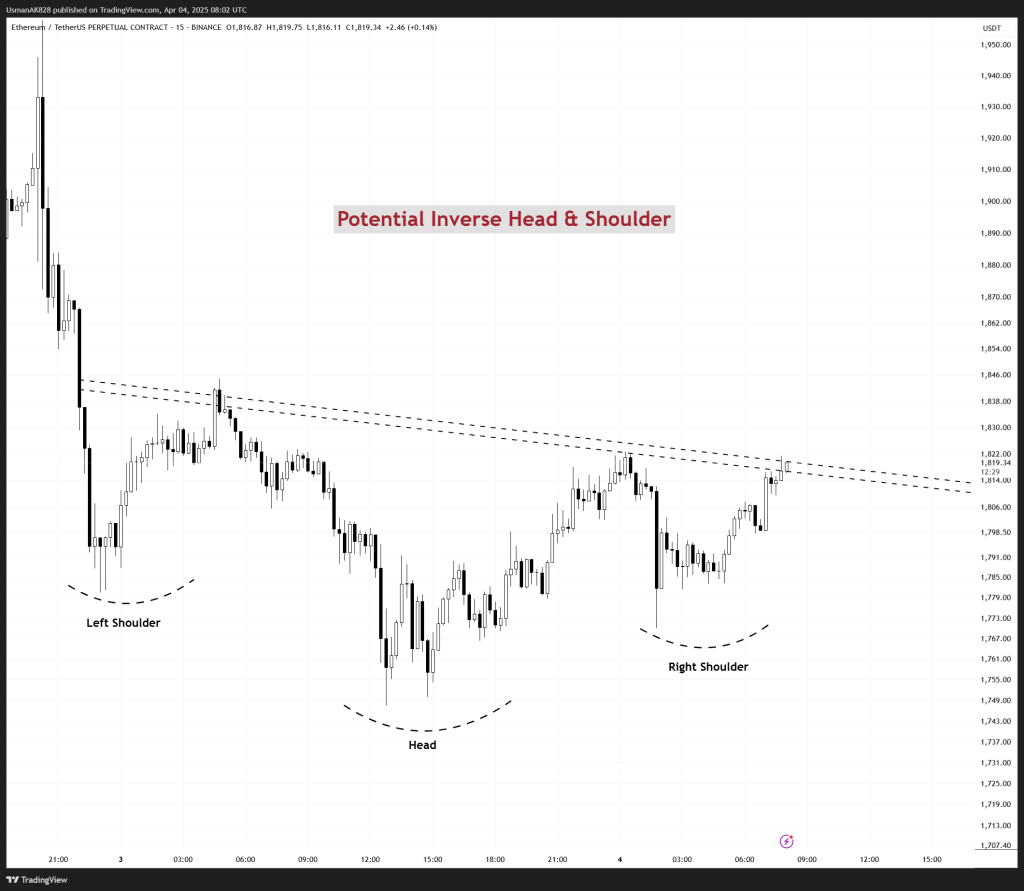
Ethereum establishing a potential inverse head and shoulder pattern. Source: TradingView
General View
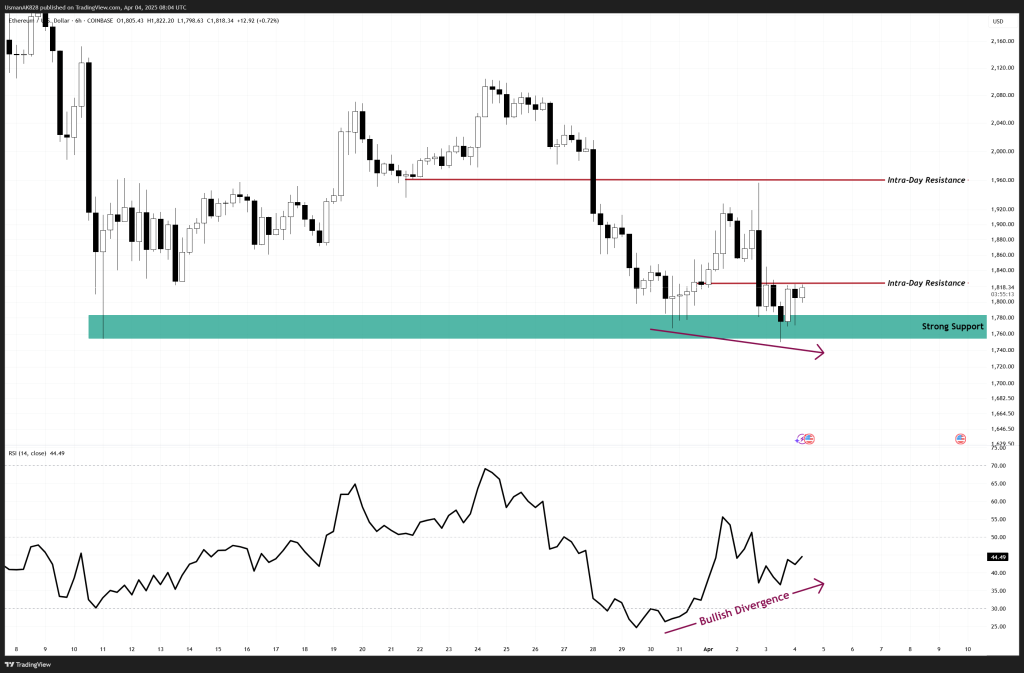
Ethereum is once again respecting the supportive region, with price bouncing back higher and now forming a potential inverse head and shoulders pattern. This is a bullish structure, but it still requires a convincing breakout above the neckline to validate the reversal. Bulls have managed to hold key support levels and avoided a renewed selling pressure. Additionally, Ethereum is starting to print a bullish divergence on the 12-hour timeframe, signaling potential upside if buyers can sustain momentum.
On The Upside
Ethereum is now testing the neckline of the inverse head and shoulders pattern, marked by a descending trendline. A successful breakout above this resistance zone could confirm the bullish reversal, opening the door for a move toward the $1860 to $1900 region. This is where some profit-taking can’t be ruled out, however, if strength persists, then further short-coverings are expected, which can drag Ethereum even higher into $1950.
On The Downside
Ethereum has Immediate support around the $1800 level. Meanwhile, below this intra-day support level, the next supportive region alligns once again at $1765 to $1750 region. This is the region that held yesterday’s sell-off. Unless the price now loses this supportive region, any further selling remains limited.

Ethereum’s bullish divergence on 6-hour time-frame. Source: TradingView