


Ethereum Technical Analysis: 20 APR 2025
Ethereum is in an ascending triangle pattern on the lower time frame. Source: TradingView
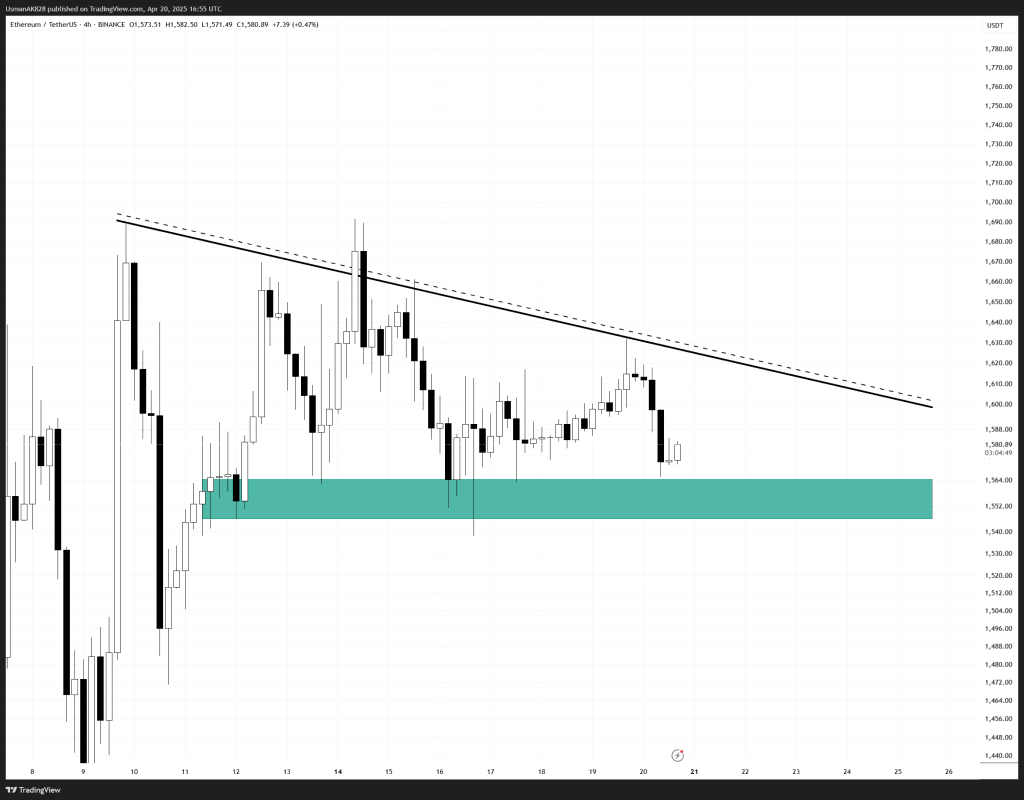
General View
Ethereum has been trading in a narrow range, but on the lower time frame, price action is shaping into a symmetrical triangle. Meanwhile, Ethereum’s weakness still remains intact as on the lower time frame, as confirmed by repeated rejections from EMA-50, some slight positive indications are starting to appear, which do suggest that if bulls now negate any fresh drop, bulls could make a comeback.
On The Upside
For bulls, the first major hurdle is the descending trendline at the $1600 level. A clean break and close above this level would signal the first step toward shifting the short-term narrative and push Ethereum towards $1625, followed by $1680 next. Above $1680, Ethereum faces a major challenge from the EMA-50.
On The Downside
Ethereum has $1570 as the first support level, followed by $1540. Both these are decent intra-day support levels for Ethereum; however, if the price goes for a deeper retest, the next wave of intra-day supports is positioned at the $1500 to $1490 level. This is the range that bulls should ideally hold to maintain the changing dynamics.
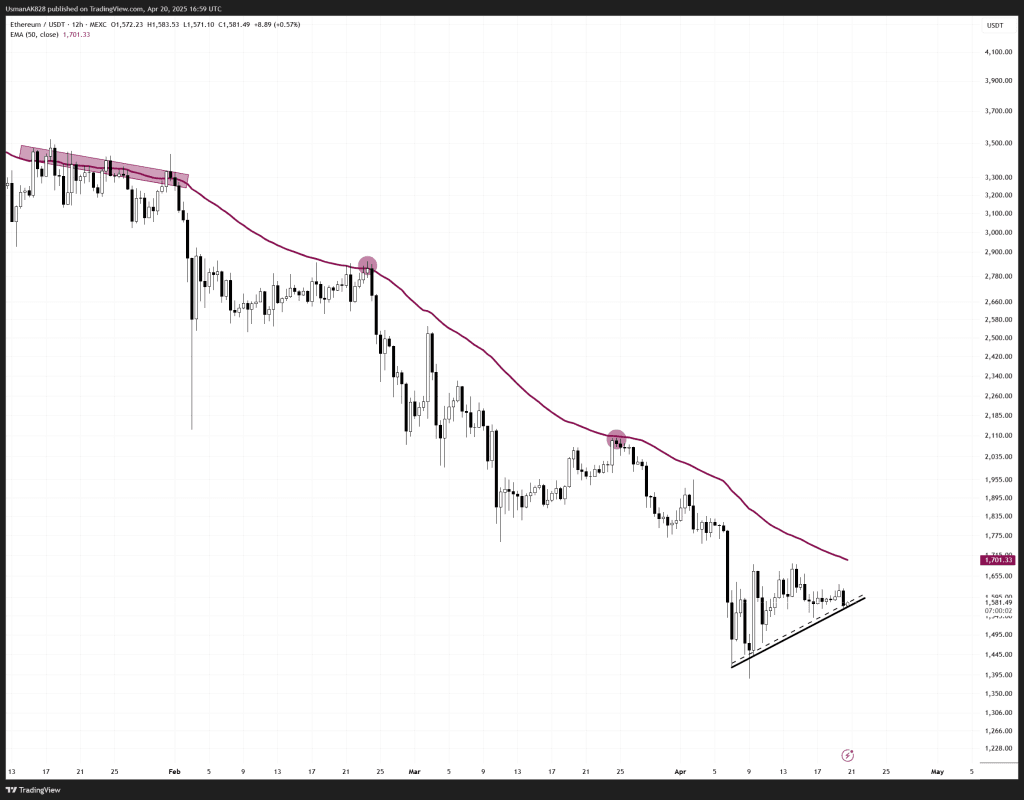
Price is getting closer to retesting the EMA-50 level. Source: TradingView


