Ethereum Technical Analysis: 5 APR 2025

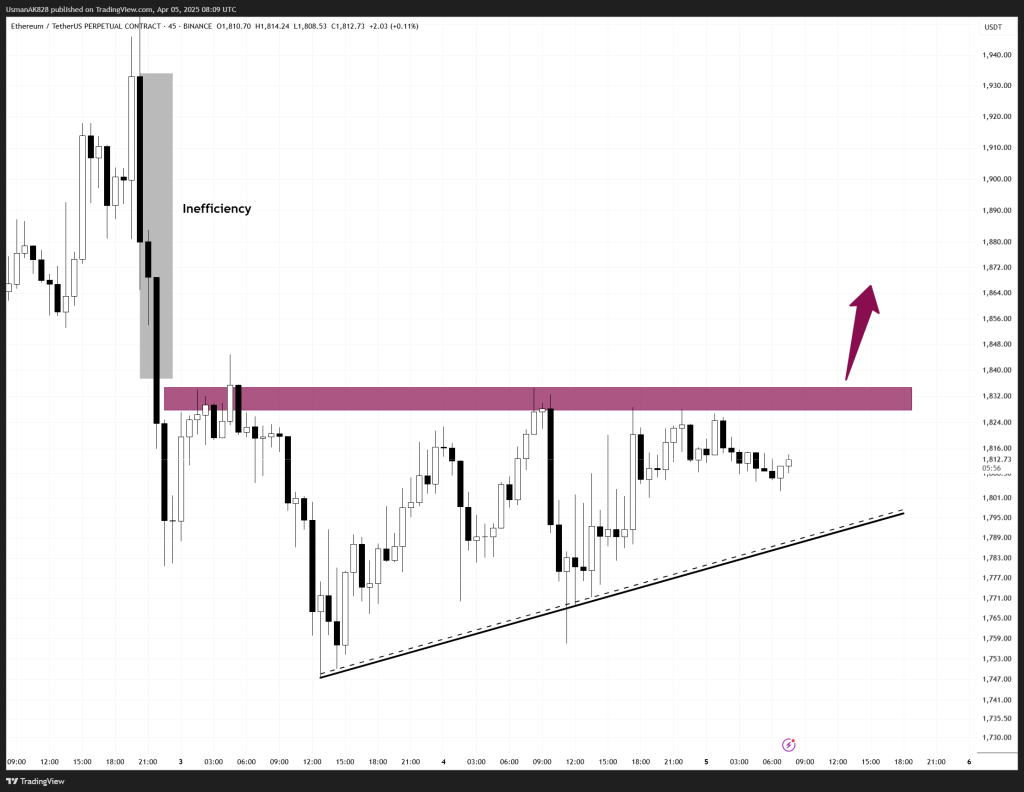
Ethereum forming an ascending triangle pattern. Source: TradingView
General View
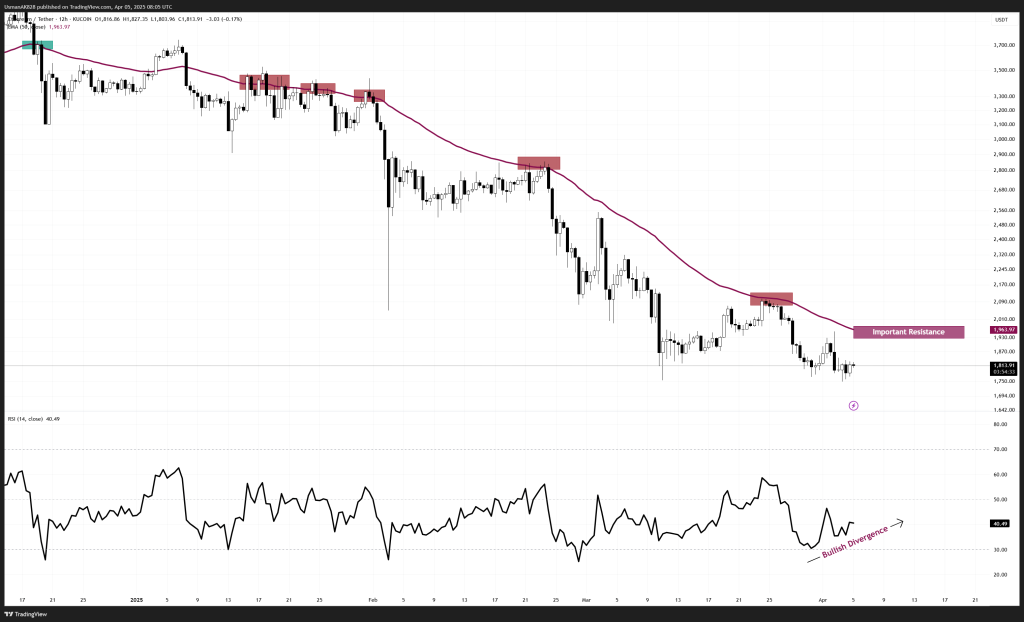
On the short-term chart, Ethereum is forming an ascending triangle pattern, signaling a growing bullish intent as price continues to print higher lows. This structure suggests that bulls are gradually absorbing supply, with momentum building for a potential breakout. Meanwhile, the higher time-frame picture remains capped by the 50 EMA, which has acted as a major resistance throughout the recent downtrend. If short-covering picks up pace, price could drive into that EMA zone, marking a critical test for bulls.
On The Upside
The immediate focus for the session is on the $1835 to $1845 level resistance zone, which is the short-term breakout region and holds plenty of unfilled inefficiency. A clean breakout above this level could open the door for a move toward $1880 to $1900 levels.
On The Downside
The rising trendline beneath the current price continues to serve as a key support structure for the day. This support is currently positioned at the $1800 level. Bulls need to hold this support level to keep the pattern validated, as any breakdown below this would once again expose Ethereum towards the lower ranges of $1765 to $1750.

12-hour time-frame showing bullish divergence on RSI. Source: TradingView