Ethereum Technical Analysis: 29 MAR 2025

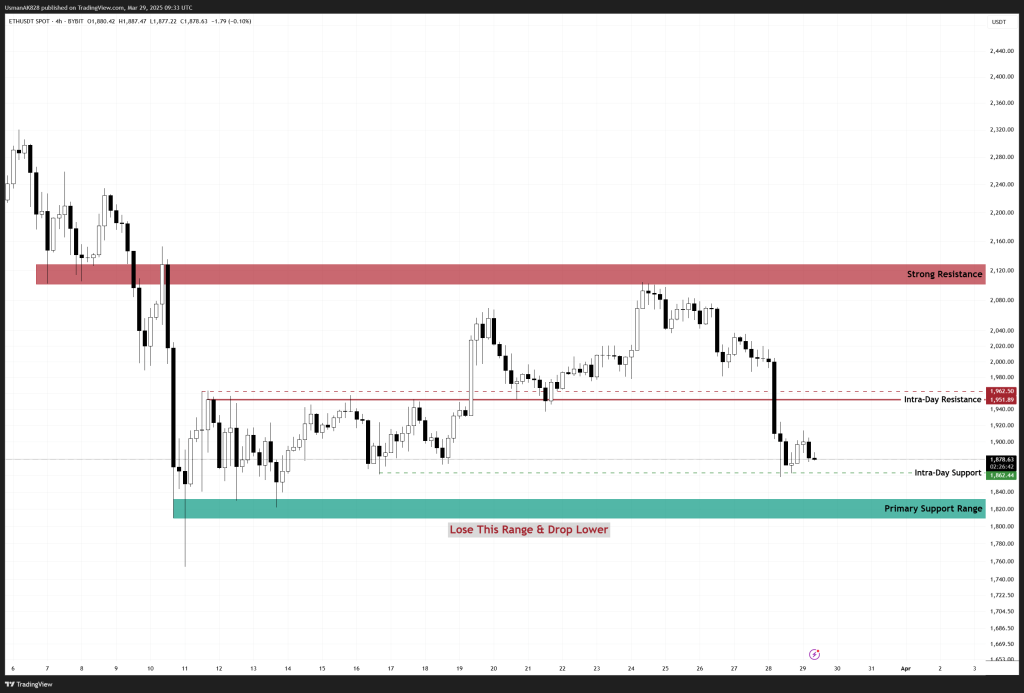
Ethereum’s price chart for 29th March 2026. Source: TradingView
General View
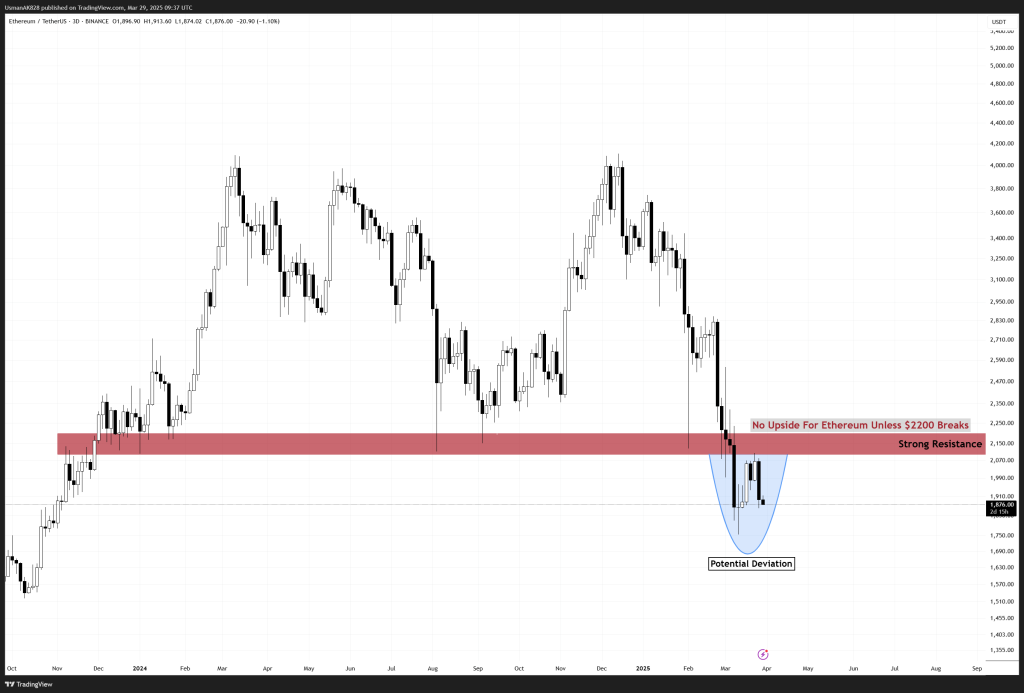
Ethereum remains under selling pressure after another rejection from the 12-hour EMA. The price has attempted to stabilize, but the bearish momentum persists. The broader trend shows that Ethereum is struggling to gain traction, with the strong resistance at $2200 acting as a major hurdle. A potential deviation pattern is forming, which could indicate a short-term bottom, but unless bulls reclaim key resistance levels, any upside remains unsustainable. However, with short-term support holding, a relief bounce remains a possibility.
On The Upside
Ethereum has lost yet another important intra-day support at $1960. If bulls can reclaim this level over the weekend, it could trigger some short-covering. However, the chances of recovering this support remain slim for now. Multiple resistance levels above continue to cap any bullish momentum, making it difficult for the price to gain traction. For the session, the primary intra-day resistance stands at $1920 and $1940.
On The Downside
Ethereum has been struggling to maintain its strength, with price currently exposed to further downside. However, the intra-day support at $1860 is holding for now. If this level is lost, Ethereum is likely to slide toward the $1800–$1820 range. This is a crucial support zone that bulls must defend to prevent further bearish weakness. A break below $1800 would expose Ethereum to a deeper drop toward $1740 next.

Ethereum failed to confirm a deviation as of now. Source: TradingView