Ethereum Technical Analysis: 14 MAR 2025

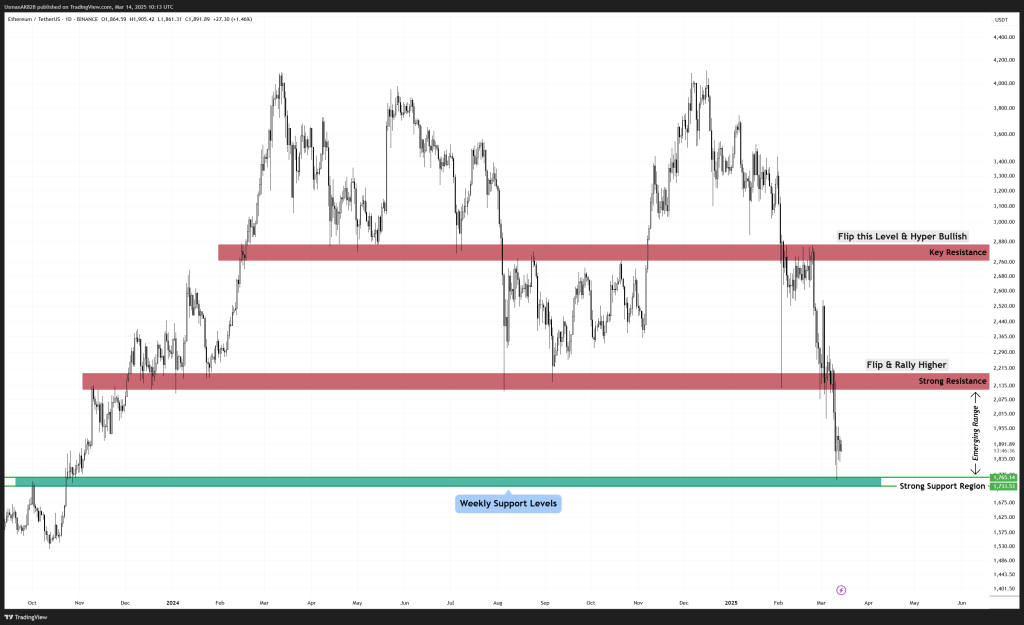
Ethereum’s daily chart dated 14th March 2024. Source: TradingView
General View
Ethereum has entered a key weekly support region after an extended downtrend. The price activity is expected to turn volatile as there is strong support beneath while there is a major hurdle above. The reactions from the weekly support suggest that sellers are now starting to lose momentum. Going forward, if bulls can establish a solid base here, it could trigger a relief rally aimed initially towards the strong resistance zone. Furthermore, any hyper bearish move at this stage from bears could backfire.
On the Upside
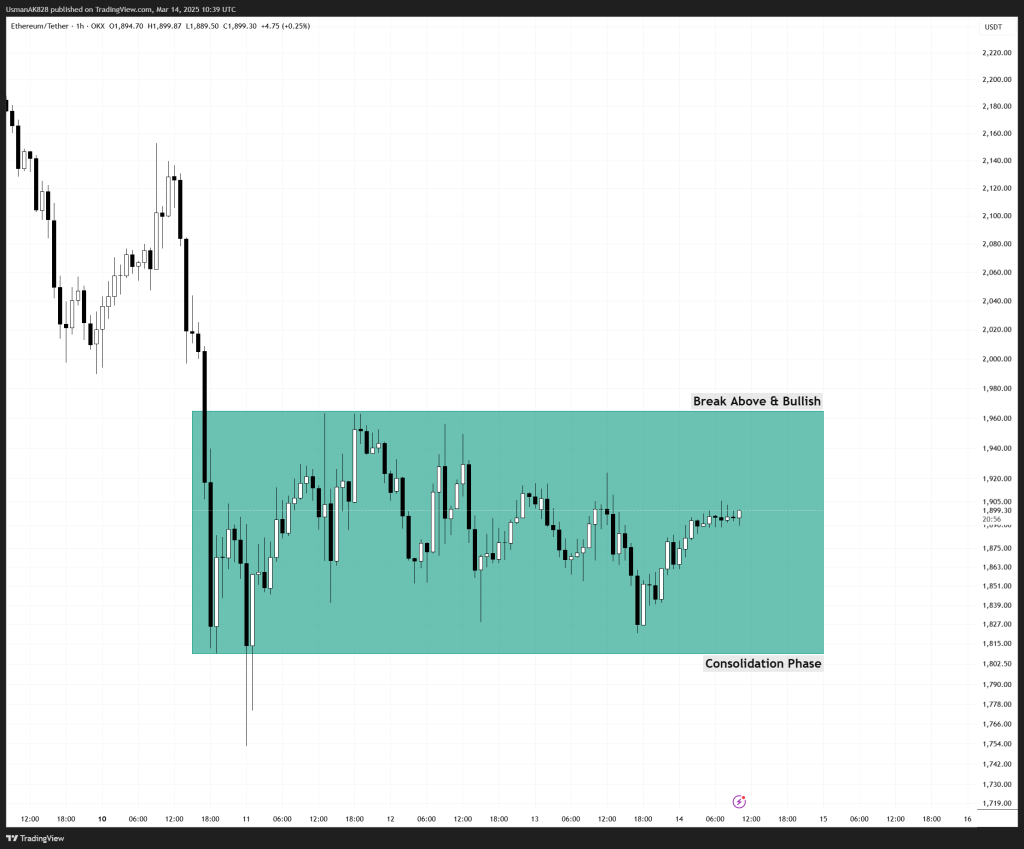
Ethereum is currently struggling against the intra-day resistance of $1960. Bulls need to find acceptance above this level to push for sustained upward momentum. If Ethereum manages to clear this milestone, a push higher is expected towards $2050 initially, followed by the strong resistance range at $2140 to $2185 levels. This is where intra-day profit-taking is likely to emerge.
On the Downside
Ethereum enjoys a wide range of supports from the lower levels. Currently, bulls are defending the intra-day supports of $1880 to $1840. As long as these levels hold, bulls are sitting in a comfortable spot and will avoid any retest of the weekly support at $1765 to $1720. Ideally, Ethereum needs to establish a solid base here to gain strength to convincingly challenge the higher resistances.

Ethereum in a consolidation phase. Source: TradingView