


- Fartcoin faces a potential correction as the TD Sequential indicator flashes a “9” sell signal.
- Price has already dropped over 10% from the recent peak, with key support levels at $1.00, $0.78, and $0.63 now in focus.
- Despite explosive 550% gains, momentum shows signs of exhaustion, raising caution among short-term traders and speculators.
With the cryptocurrency rocketing 550% over a couple of months, Fartcoin (FART/USDT) is flashing a warning sign as crucial technical indicators continue to show red. Ali Martinez, a prominent crypto analyst shared a recent 3-day candlestick chart that demonstrates the TD Sequential indicator that was printed a “9” sell signal, which is historically used to predict that the trend will be exhausted.
TD Sequential Signals Exhaustion
The Thomas Demark Sequential TD indicator is a trend indicator to find the turning points in price trends. The green “9” that may signal a reversal or at least stop in bullish momentum occurs upon a sustained trend to the upside. In the case of Fartcoin, this sell signal appeared trading around the roughly $1.28 level, right at a psychologically and technically important resistance zone.
Fartcoin is seen peaking at $1.2890 before trending lower to $1.1125 representing a 10.61% retracement in the last 3 days’ candle. TD Sequential’s warning here gets confirmation from this bearish movement and the build-up of profit-taking pressure after such a long run.
Key Support Zones to Fibonacki Levels
Also in the analysis is Fibonacci retracement levels drawn from the most recent low near $0.19 up to the local high to $1.2890. The levels surrounding these levels provide potential support targets if further downside is seen.
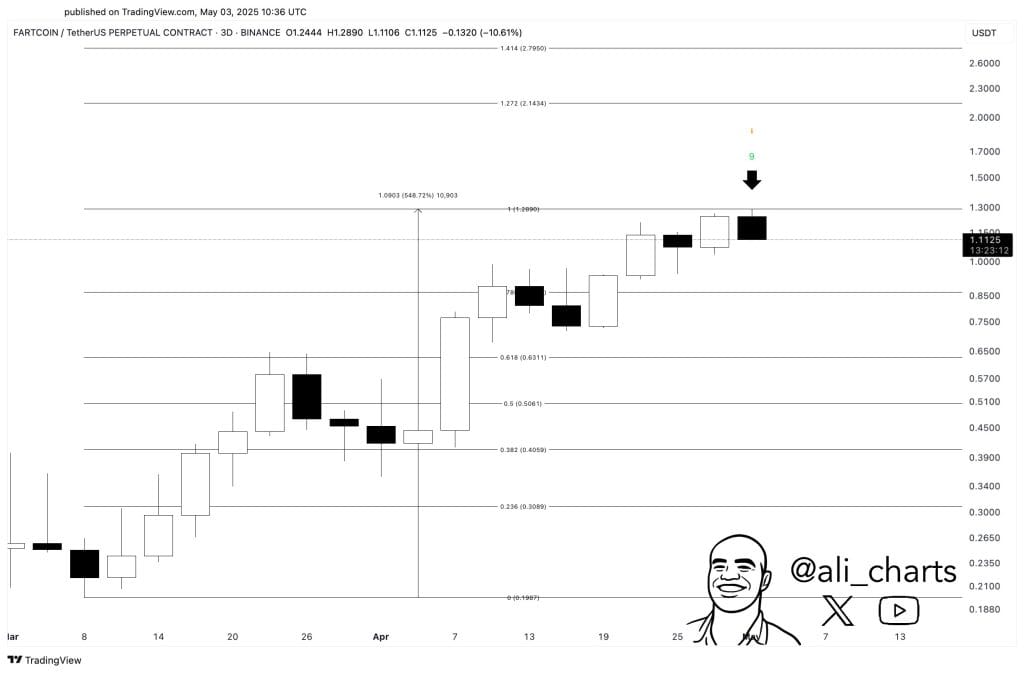
A critical support level is 0.618 at $0.6311, the same level that proved to be a launch pad for bullish continuations in the past. Two mid-range floors could be found to offer buying interest if correction deepens at 0.5 level at $0.5061 and 0.382 level at $0.4059.
However, it’s positive that the Fartcoin would need to recover its $1.28 level to resume its bullish momentum and reach the 1.272 ($2.14) and 1.414 ($2.79) Fibonacci extension extension levels.
What’s Next for Fartcoin?
This could be a key moment of decision-making for traders and investors. Long-term holders may see dips as a correction to long-term uptrend, short term ones need to be careful. Fartcoin can retrace to the $0.78 and $0.63 levels in the short term if the $1.00 support fails to hold.
On the other end, invalidation of the sell signal would take place if the current chart can’t confirm a strong breakout above $1.29 with increasing volume.
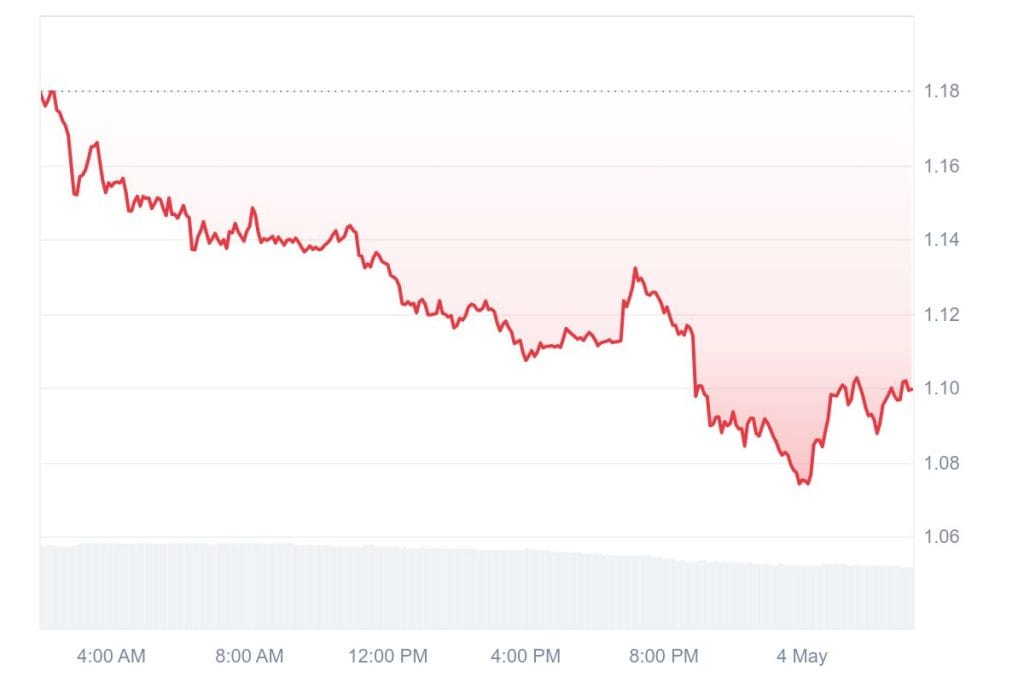
Currently, Fartcoin (FARTCOIN) trades at around $1.09 showing a 6.01% decrease over the last 24 hours. The market capitalization of cryptocurrency is around $1.09 billion and is #68 on Coinmarketcap with a 24H trading volume of $110.72 million. About 1 billion tokens are in the circulating supply of FARTCOIN, which is close to its maximum supply limit.
The historical performance has come among a remarkable price journey that makes it reach an all-time high (ATH) valued at $2.61 on January 19, 2025. On the other hand, its all-time low (ATL) was just $0.000004723 on October 18, 2024, so there is big price volatility and growth potential in a few months.


