


LTC Technical Analysis: 20 APR 2025
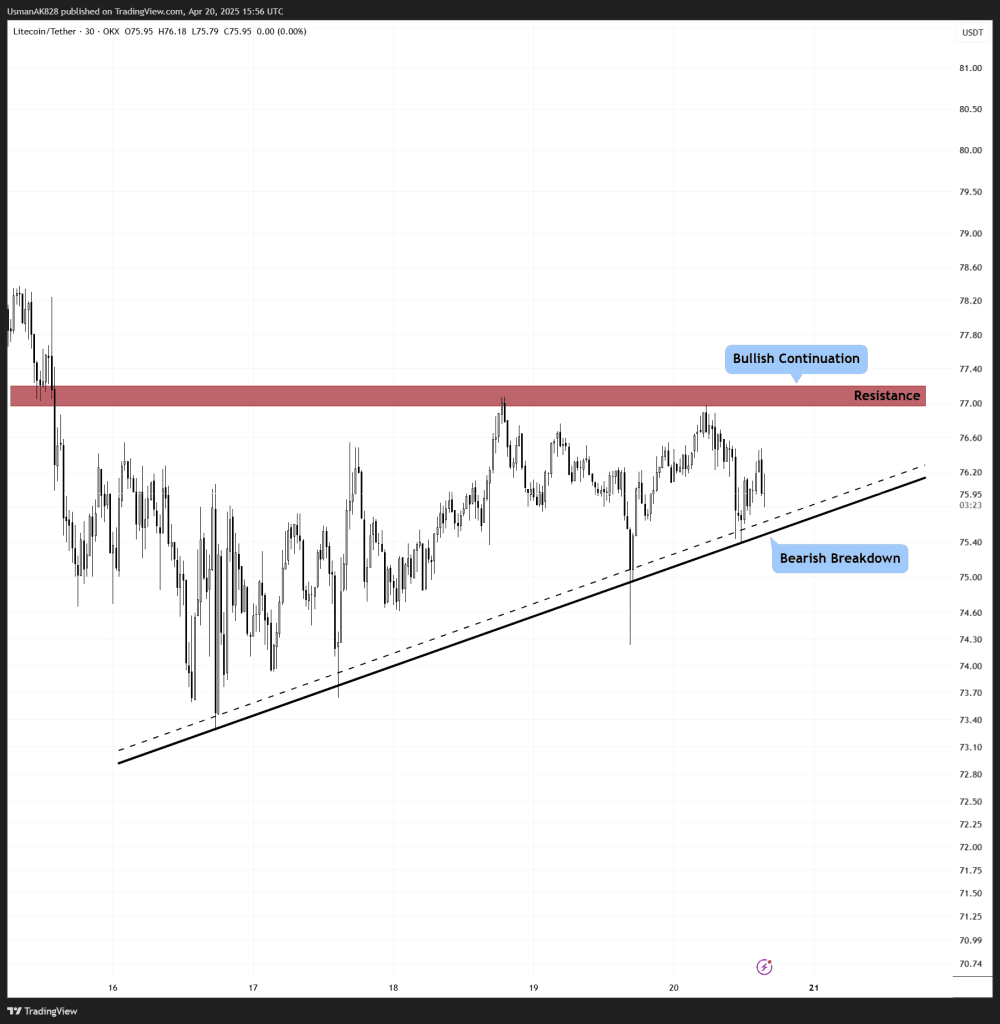
LTC is in a short-term ascending triangle. Source: TradingView
General View
Litecoin has shown strength over the past few sessions, gradually climbing higher and now consolidating just beneath a key resistance band. LTC is inside an ascending triangle pattern on the lower-time frame. Additionally, the 38.2% Fibonacci retracement zone is acting as an important demand zone, absorbing sell pressure for now. If this strength holds, bulls could once again see momentum build towards the $80 region.
On The Upside
For LTC strength above $77.30 could mark a turning point in the short term. This would allow the price to move higher towards $78.80, followed by the $80.00 mark, which is now beginning to emerge as a major level. Over the past few days, the $80.00 resistance has caused bulls all sorts of problems in the short term.
On The Downside
The ascending trendline around $75.25 and the 0.382 Fibonacci level at $73.90 are key support areas for LTC. Bulls need to hold these supports to maintain any upper hand, meanwhile, sellers need to drag the price below these support levels to expose LTC lower into $72 and potentially $68.80 next.
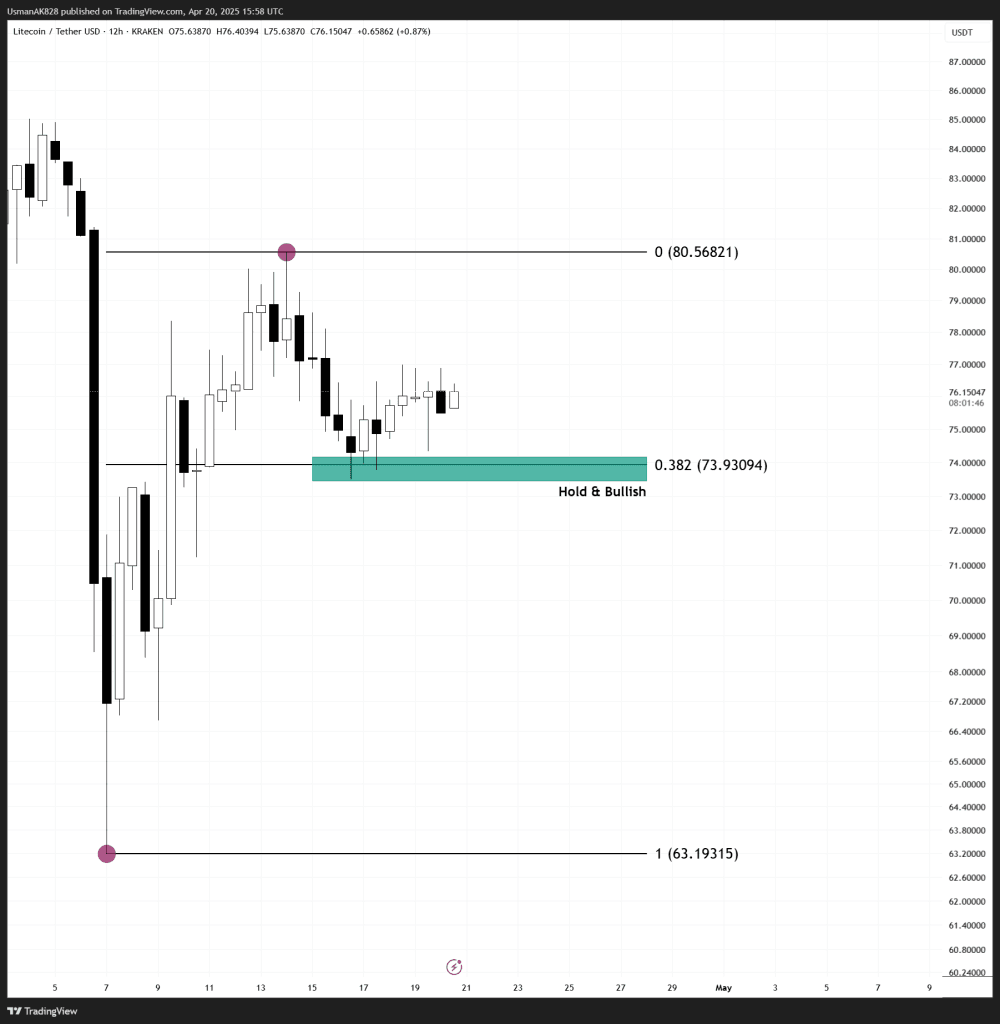
38.2% Fibonacci support level holding the price. Source: TradingView


