


Solana Technical Analysis: 22 APR 2025
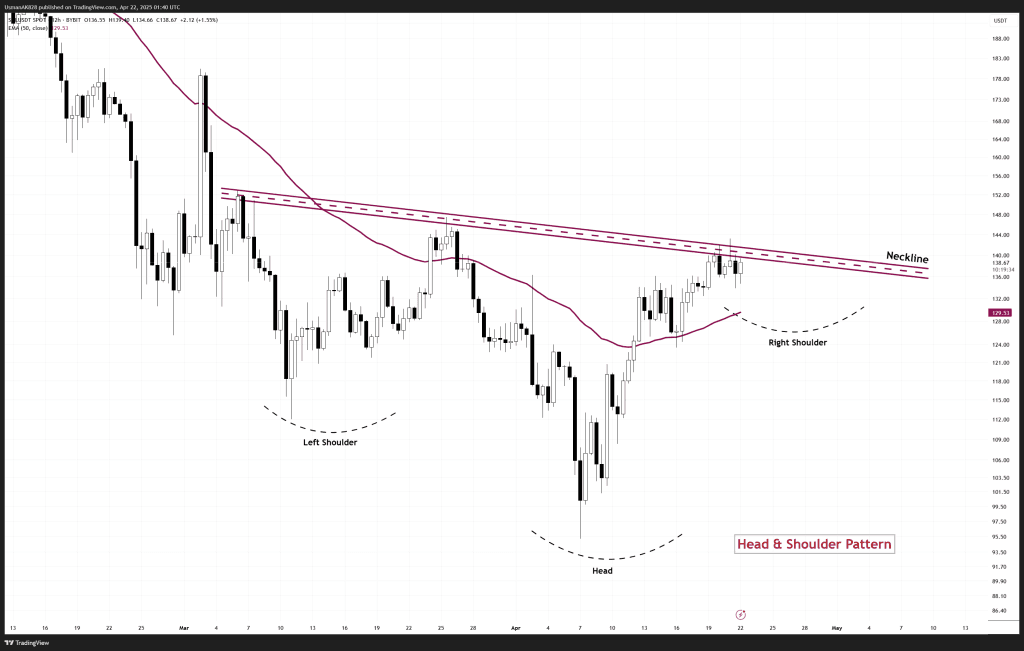
Solana is establishing a potential inverse head and shoulder pattern. Source: TradingView
General View
Solana has displayed impressive strength in recent sessions by not only reclaiming the important weekly support zone, rather price is now establishing an inverse head and shoulder pattern. Currently price is knocking on the neckline resistance, and a breakout above this would confirm a bullish break through for Solana. If bulls can maintain momentum above the reclaimed support levels, the stage could be set for a broader recovery toward the key Fibonacci resistance levels.
On The Upside
Bulls have been showing strength for some time, and now a stronghold above the neckline resistance at $138 to $140 levels would confirm the breakout on an inverse Head and Shoulders pattern. The breakout would further strengthen the bulls with a sharper rally towards the 38.2% Fibonacci resistance at $170. Meanwhile, there will still be intra-day resistances at $155 and $162 levels.
On The Downside
However, if Solana fails to clear the neckline, selling pressure could resurface. This would partially push price into some lower level retests around $132, where the primary intra-day support is positioned, followed by $129, where the 12-hourly dynamic EMA is present. Both these levels are expected to reverse any selling pressure.
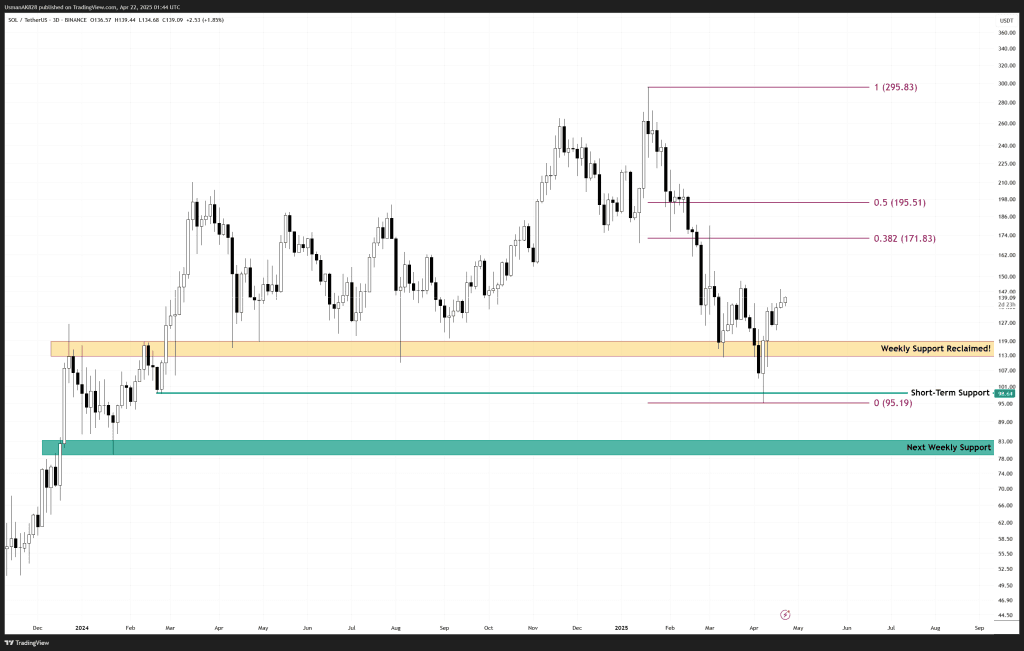
Weekly support levels have now been reclaimed. Source: TradingView


