


Solana Technical Analysis: 15 MAR 2025
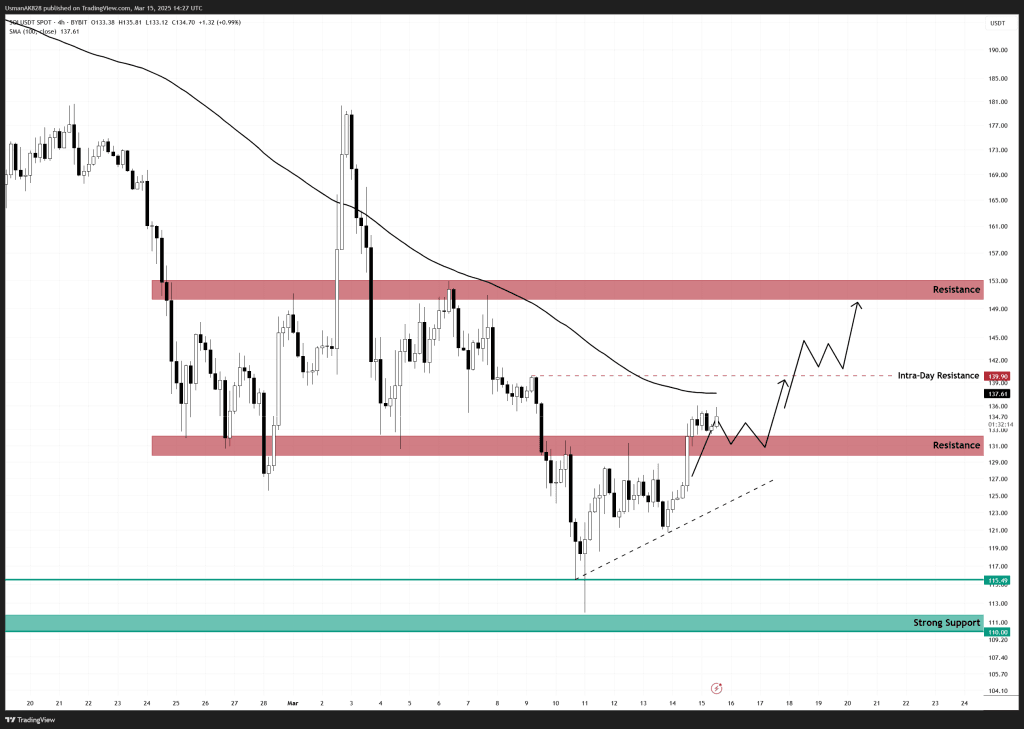
Solana’s price chart for 15th March 2025. Source: TradingView
General View
Price steadily climbs as Solana breaks out of the ascending triangle pattern. The bulls are currently holding the breakout, however, the price is starting to feel pressure from the MA-100 level. If bulls can hold above the breakout level in the coming hours and break the MA-100 resistance, then the door opens for an extended push toward higher resistance zones. Meanwhile, sustained strength could further accelerate recovery.
On the Upside
Solana faces immediate resistance at the $137.60 level. This level is occupied by the MA-100, a level that has not been convincingly reclaimed since January 2025. A breakout above this resistance would show strong bullish intent. Above the MA-100 resistance level, the next intra-day resistance is at $139.90, and clearing this level extends the upside towards $150.00 to $153.50.
On the Downside
Price has successfully flipped the $129.80 to $132.00 resistance into support, establishing a strong intra-day base. Now, as long as this range holds, bulls have nothing to worry about. However, any pullback below this range would slow down the momentum and expose Solana to a deeper correction towards the trendline support at $125.
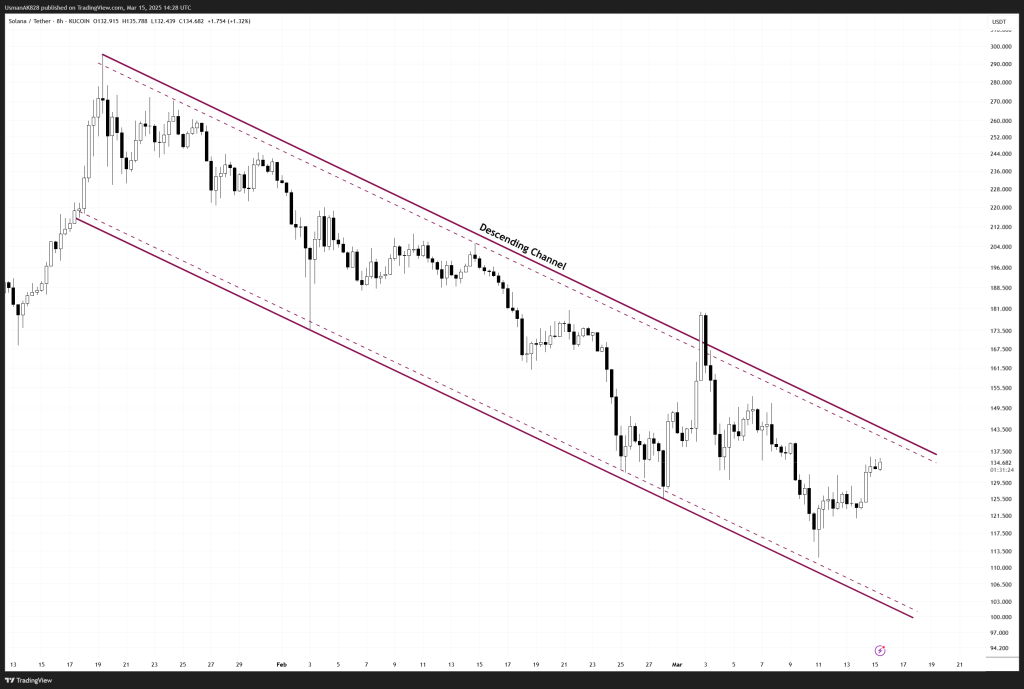
Solana’s ongoing descending channel formation. Source: TradingView


